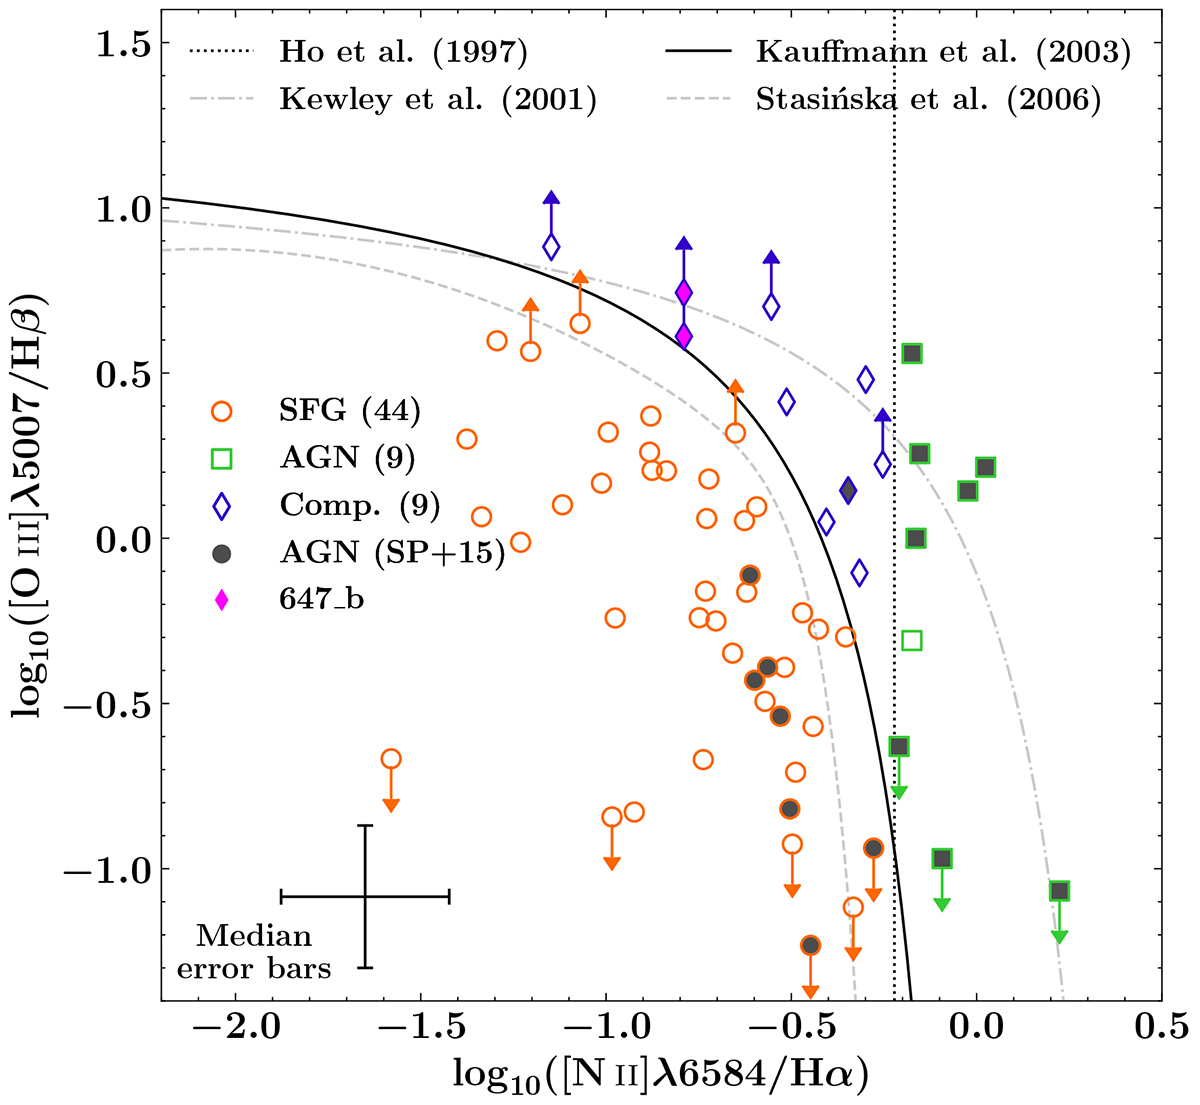
Fig. 5.
Download original image
Baldwin-Phillips-Terlevich diagram of 62 galaxies of Cl0024. The position in the BPT diagram of each galaxy was calculated using [O III]λ5007/Hβ and [N II]λ6583/Hα ratios when either [O III]λ5007 or Hβ flux was available; in the case where only one of the two fluxes was available, an upper limit of the flux, estimated from the continuum level, was used (arrows on the diagram). The prescriptions of Ho et al. (1997), Kewley et al. (2001), Stasińska et al. (2006), and Schawinski et al. (2007) are shown in the diagram, as well as Kauffmann et al. (2003)’s, which we used as the separation between SFGs and AGN galaxies. Orange circles are SFGs, green squares are AGN galaxies and blue diamonds are composite galaxies. We also show the galaxies initially classified as AGN hosts by SP15 using grey-filled symbols and the two positions in the diagram of the galaxy 647_b with two pink diamonds since it has two MOS spectra with Hβ detections. The median of the uncertainty bars are shown in the lower-left part of the figure.
Current usage metrics show cumulative count of Article Views (full-text article views including HTML views, PDF and ePub downloads, according to the available data) and Abstracts Views on Vision4Press platform.
Data correspond to usage on the plateform after 2015. The current usage metrics is available 48-96 hours after online publication and is updated daily on week days.
Initial download of the metrics may take a while.