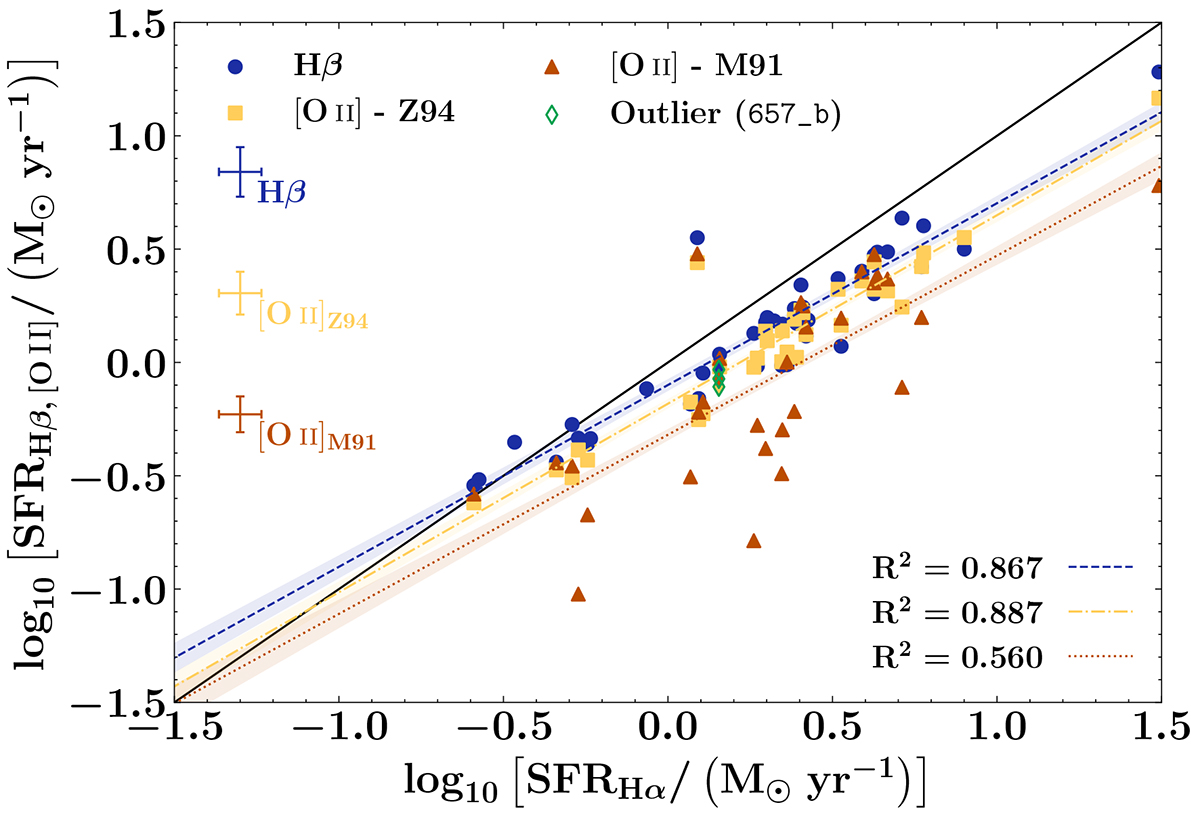
Fig. 7.
Download original image
Hβ and [O II] SFRs with respect to Hα SFR for the SFGs of our sample. We show the Hβ (blue circles) and [O II] SFR, with a correction based on the chemical abundance using Z94 (yellow squares) and M91 (brown triangles) gas metallicities. The solid black line is the one-to-one relation. The green diamonds show the SFRs of one outlier, 657_b; the other seven outliers are non-SFGs, interlopers or do not have [O II] or Hβ SFRs). The coloured dashed lines represent the linear fittings of each distribution of SFRs, and the semi-transparent colour areas represent a 1σ deviation of each fit. On the left we show the medians of the uncertainty bars of each SFR distribution.
Current usage metrics show cumulative count of Article Views (full-text article views including HTML views, PDF and ePub downloads, according to the available data) and Abstracts Views on Vision4Press platform.
Data correspond to usage on the plateform after 2015. The current usage metrics is available 48-96 hours after online publication and is updated daily on week days.
Initial download of the metrics may take a while.