Fig. 9.
Download original image
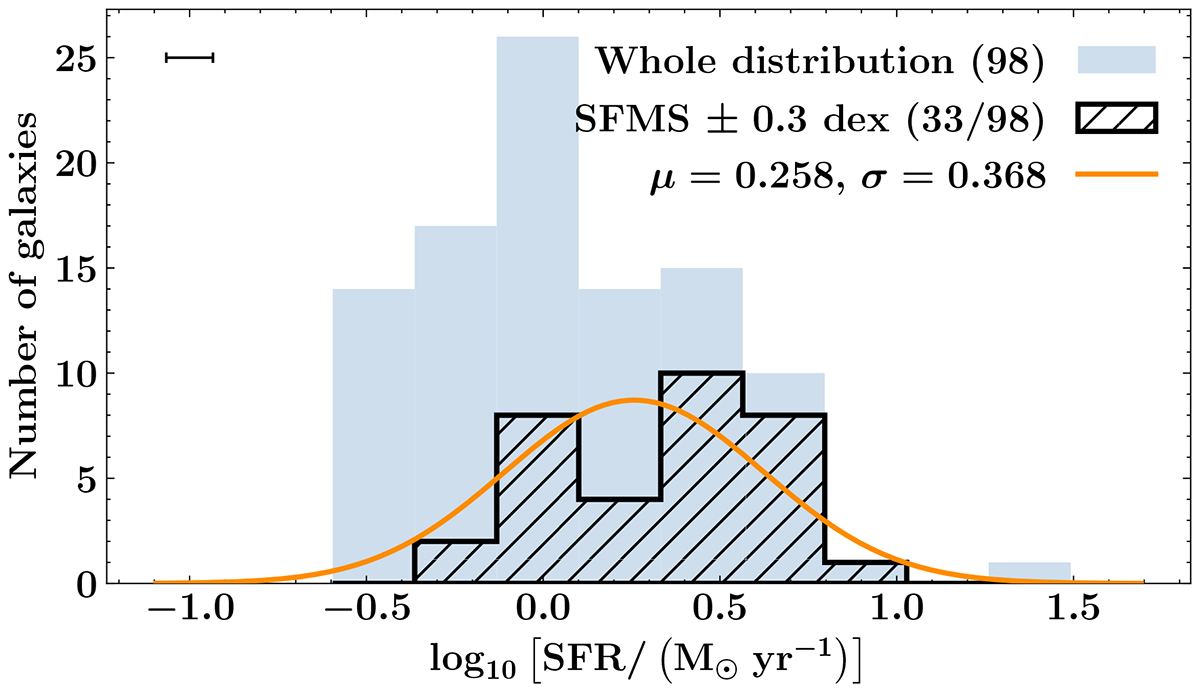
Histogram of SFRs for the Cl0024 cluster. The blue histogram represents the whole SFR distribution, while the hatched black histogram is the galaxies in the range of SFMS ± 0.3 dex. We indicate the number of galaxies between parentheses in the legend. We fit the black histogram with a single Gaussian fit, depicted by the orange curve. The value of σ of the Gaussian fit is used to estimate the separation between active, suppressed and passive galaxies, following Finn et al. (2023) methodology. In the upper-left corner we show the median of the uncertainty bars of the SFRs.
Current usage metrics show cumulative count of Article Views (full-text article views including HTML views, PDF and ePub downloads, according to the available data) and Abstracts Views on Vision4Press platform.
Data correspond to usage on the plateform after 2015. The current usage metrics is available 48-96 hours after online publication and is updated daily on week days.
Initial download of the metrics may take a while.