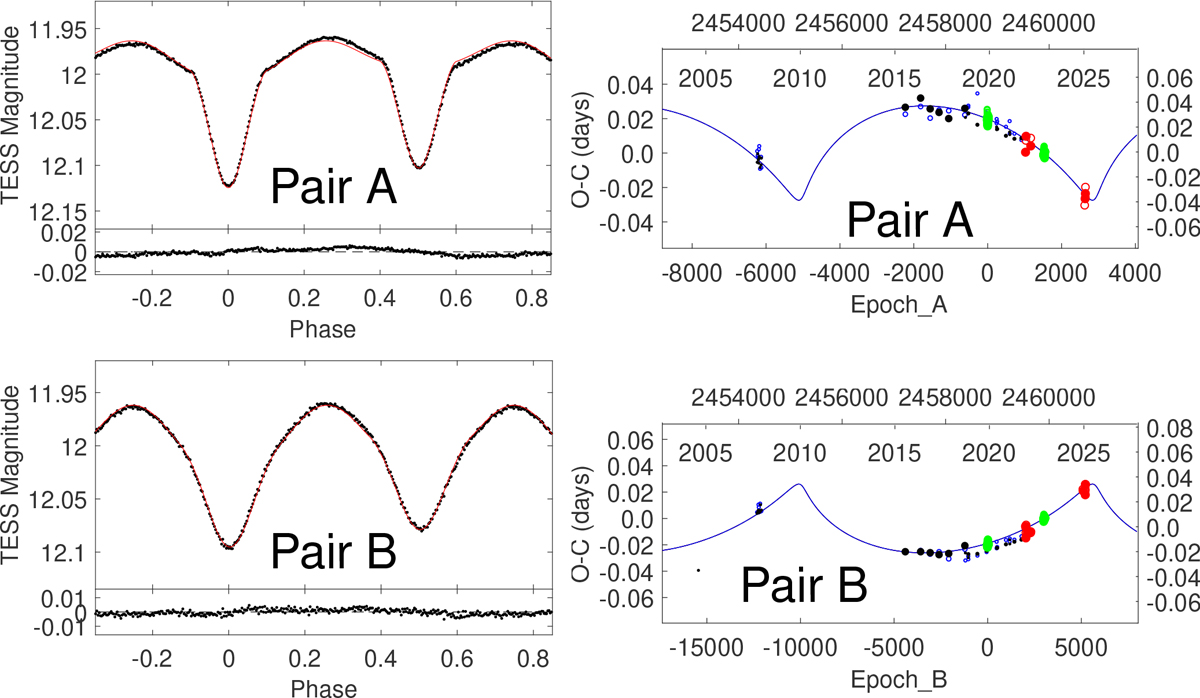
Fig. 1.
Download original image
Analysis of the CzeV1254 system. Left-hand side: Light curves of both disentangled pairs, A and B, based on the TESS data (residuals given in the bottom plots). Right figures: ETV diagrams of both pairs as they revolve around a common barycenter. Full dots stand for primary eclipses, and open circles for the secondary ones. Green symbols represent the TESS data, and red ones our new dedicated observations. The remaining symbols are the other photometric surveys.
Current usage metrics show cumulative count of Article Views (full-text article views including HTML views, PDF and ePub downloads, according to the available data) and Abstracts Views on Vision4Press platform.
Data correspond to usage on the plateform after 2015. The current usage metrics is available 48-96 hours after online publication and is updated daily on week days.
Initial download of the metrics may take a while.