Fig. 3.
Download original image
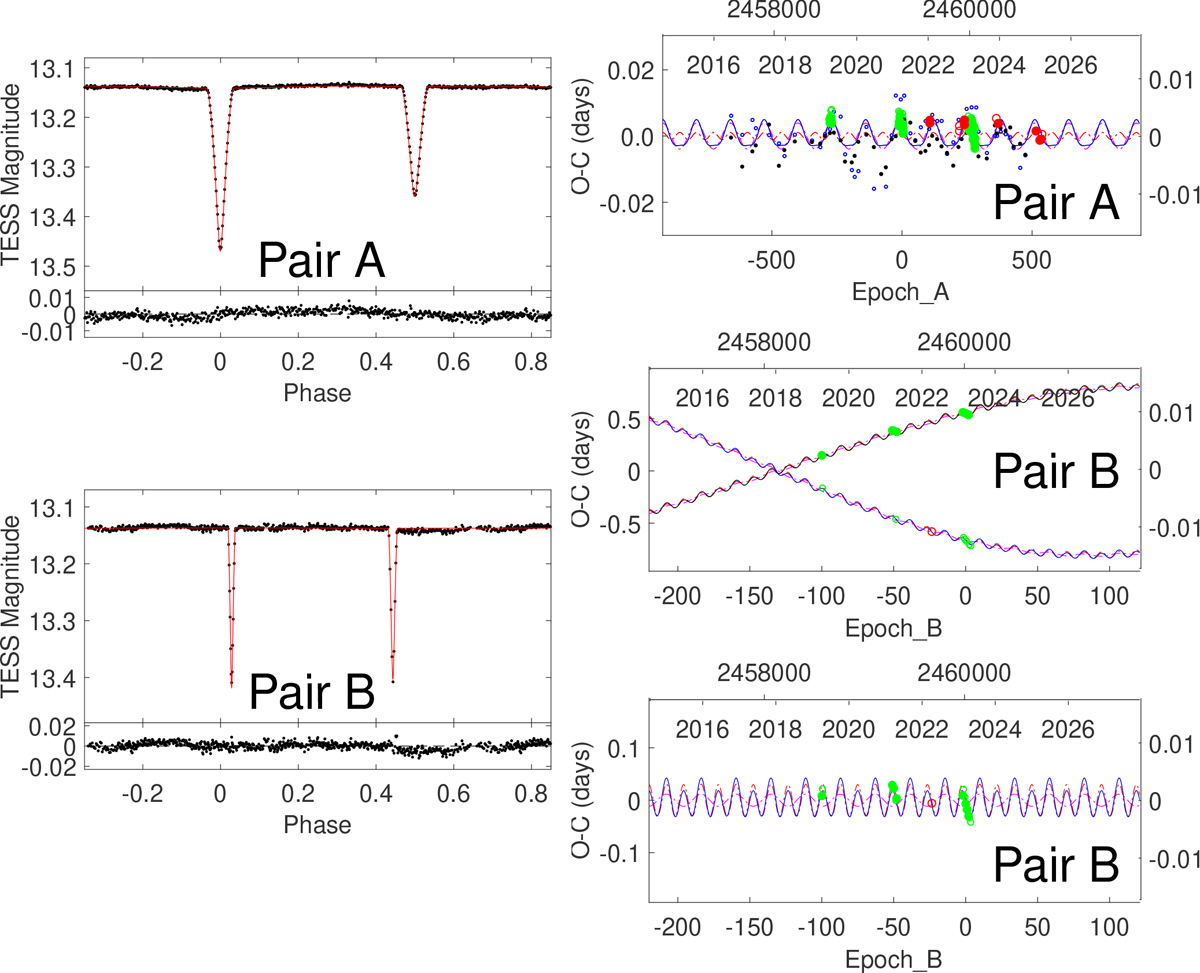
Analysis of the ASASSN-V J091951.17-593306.9 system. In the right-hand side figures are the ETV variations plotted twice for pair B. The upper plot is the complete ETV diagram (i.e. apsidal motion + Römer delay + physical delay). The lower figure is plotted after subtraction of the apsidal motion. The blue curve is the final combined fit, the red one stands for the physical delay, and the magenta is the Römer delay (LITE).
Current usage metrics show cumulative count of Article Views (full-text article views including HTML views, PDF and ePub downloads, according to the available data) and Abstracts Views on Vision4Press platform.
Data correspond to usage on the plateform after 2015. The current usage metrics is available 48-96 hours after online publication and is updated daily on week days.
Initial download of the metrics may take a while.