Open Access
Fig. 14
Download original image
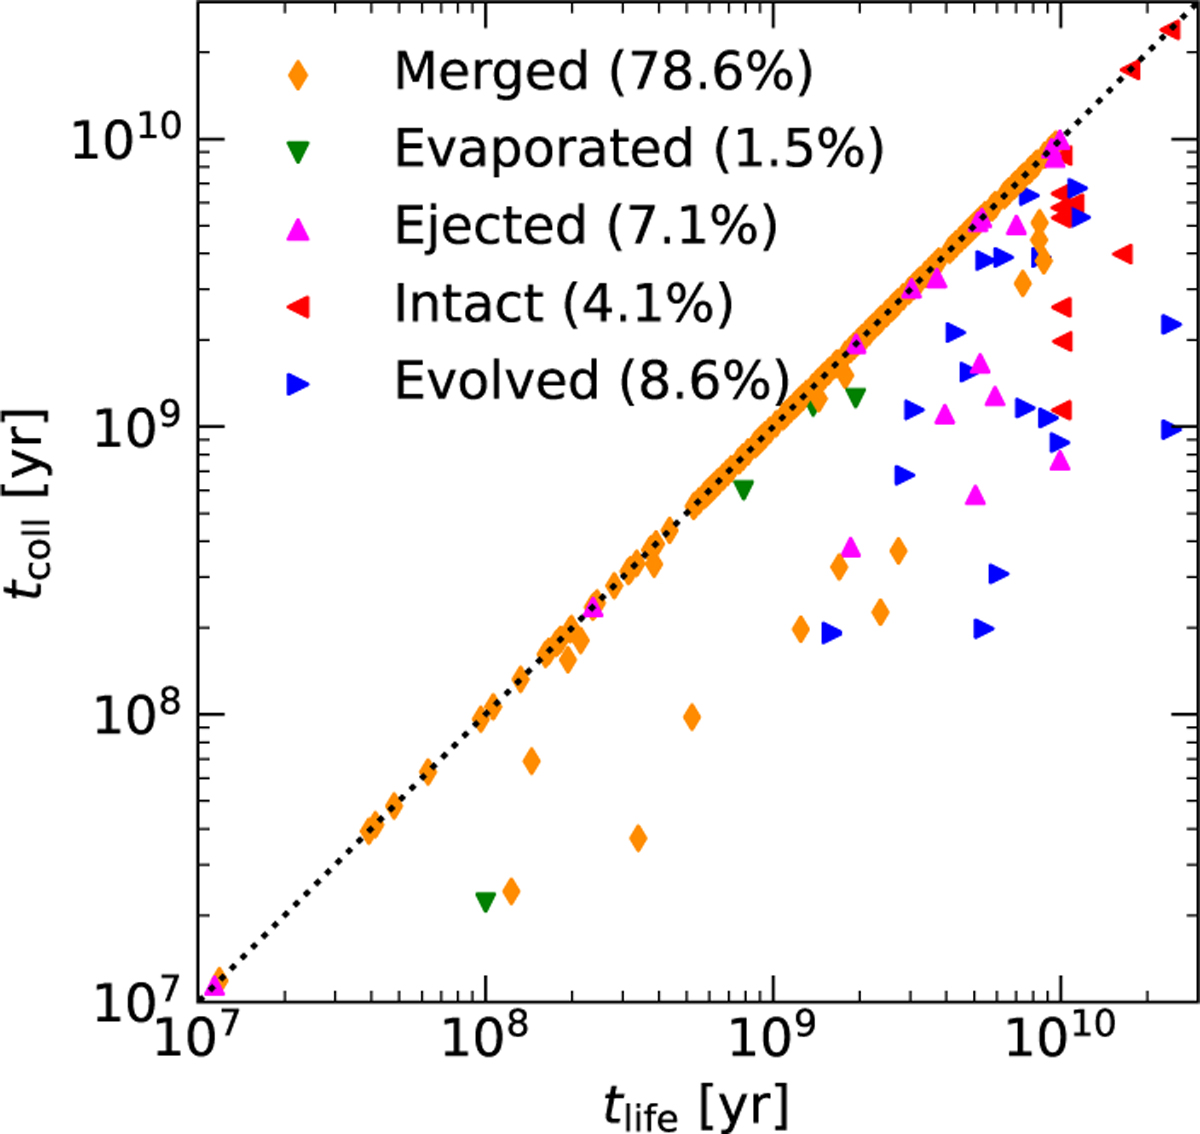
Time of final outcome versus the time of collision for binaries that have suffered at least one collision. The dotted black line shows where tlife = tcoll; points on this line meet their final outcome as a direct consequence of the collision. The points are colour-coded based on the outcome similarly to Fig. 3.
Current usage metrics show cumulative count of Article Views (full-text article views including HTML views, PDF and ePub downloads, according to the available data) and Abstracts Views on Vision4Press platform.
Data correspond to usage on the plateform after 2015. The current usage metrics is available 48-96 hours after online publication and is updated daily on week days.
Initial download of the metrics may take a while.