Fig. 15
Download original image
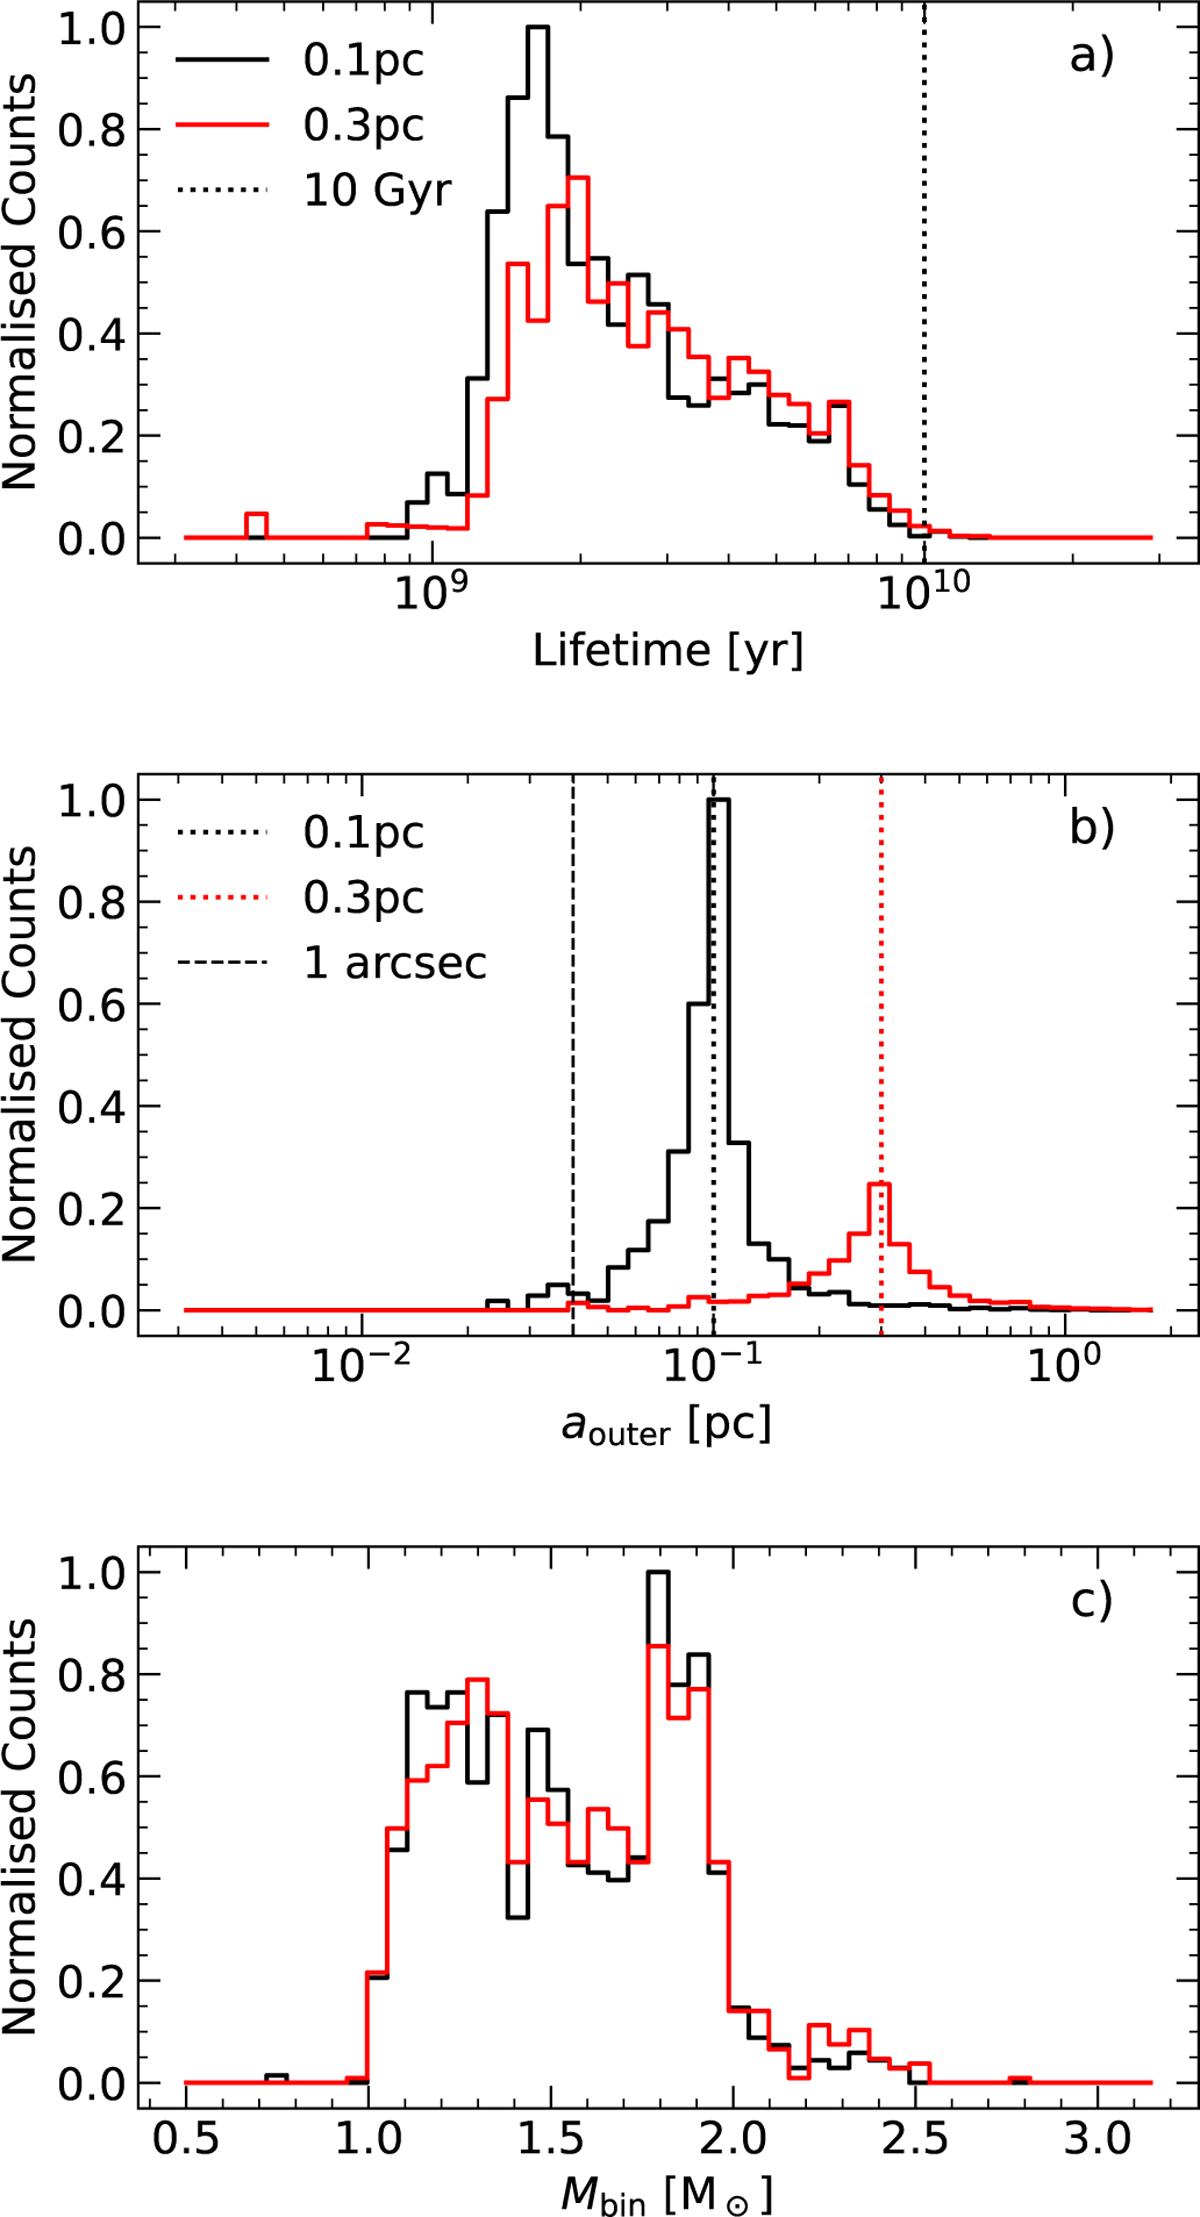
Panel a: normalised histograms for the total expected lifetime of the mergers. The dotted black line marks the age of the NSC at 10 Gyr. Panel b: post-merger semi-major axis around the SMBH. The dotted vertical lines mark the initial separations. The solid vertical line marks 1 arcsecond. Panel c: total mass after the merger. For all panels, binaries originating at 0.1 pc (0.3 pc) are shown in black (red).
Current usage metrics show cumulative count of Article Views (full-text article views including HTML views, PDF and ePub downloads, according to the available data) and Abstracts Views on Vision4Press platform.
Data correspond to usage on the plateform after 2015. The current usage metrics is available 48-96 hours after online publication and is updated daily on week days.
Initial download of the metrics may take a while.