Fig. 16
Download original image
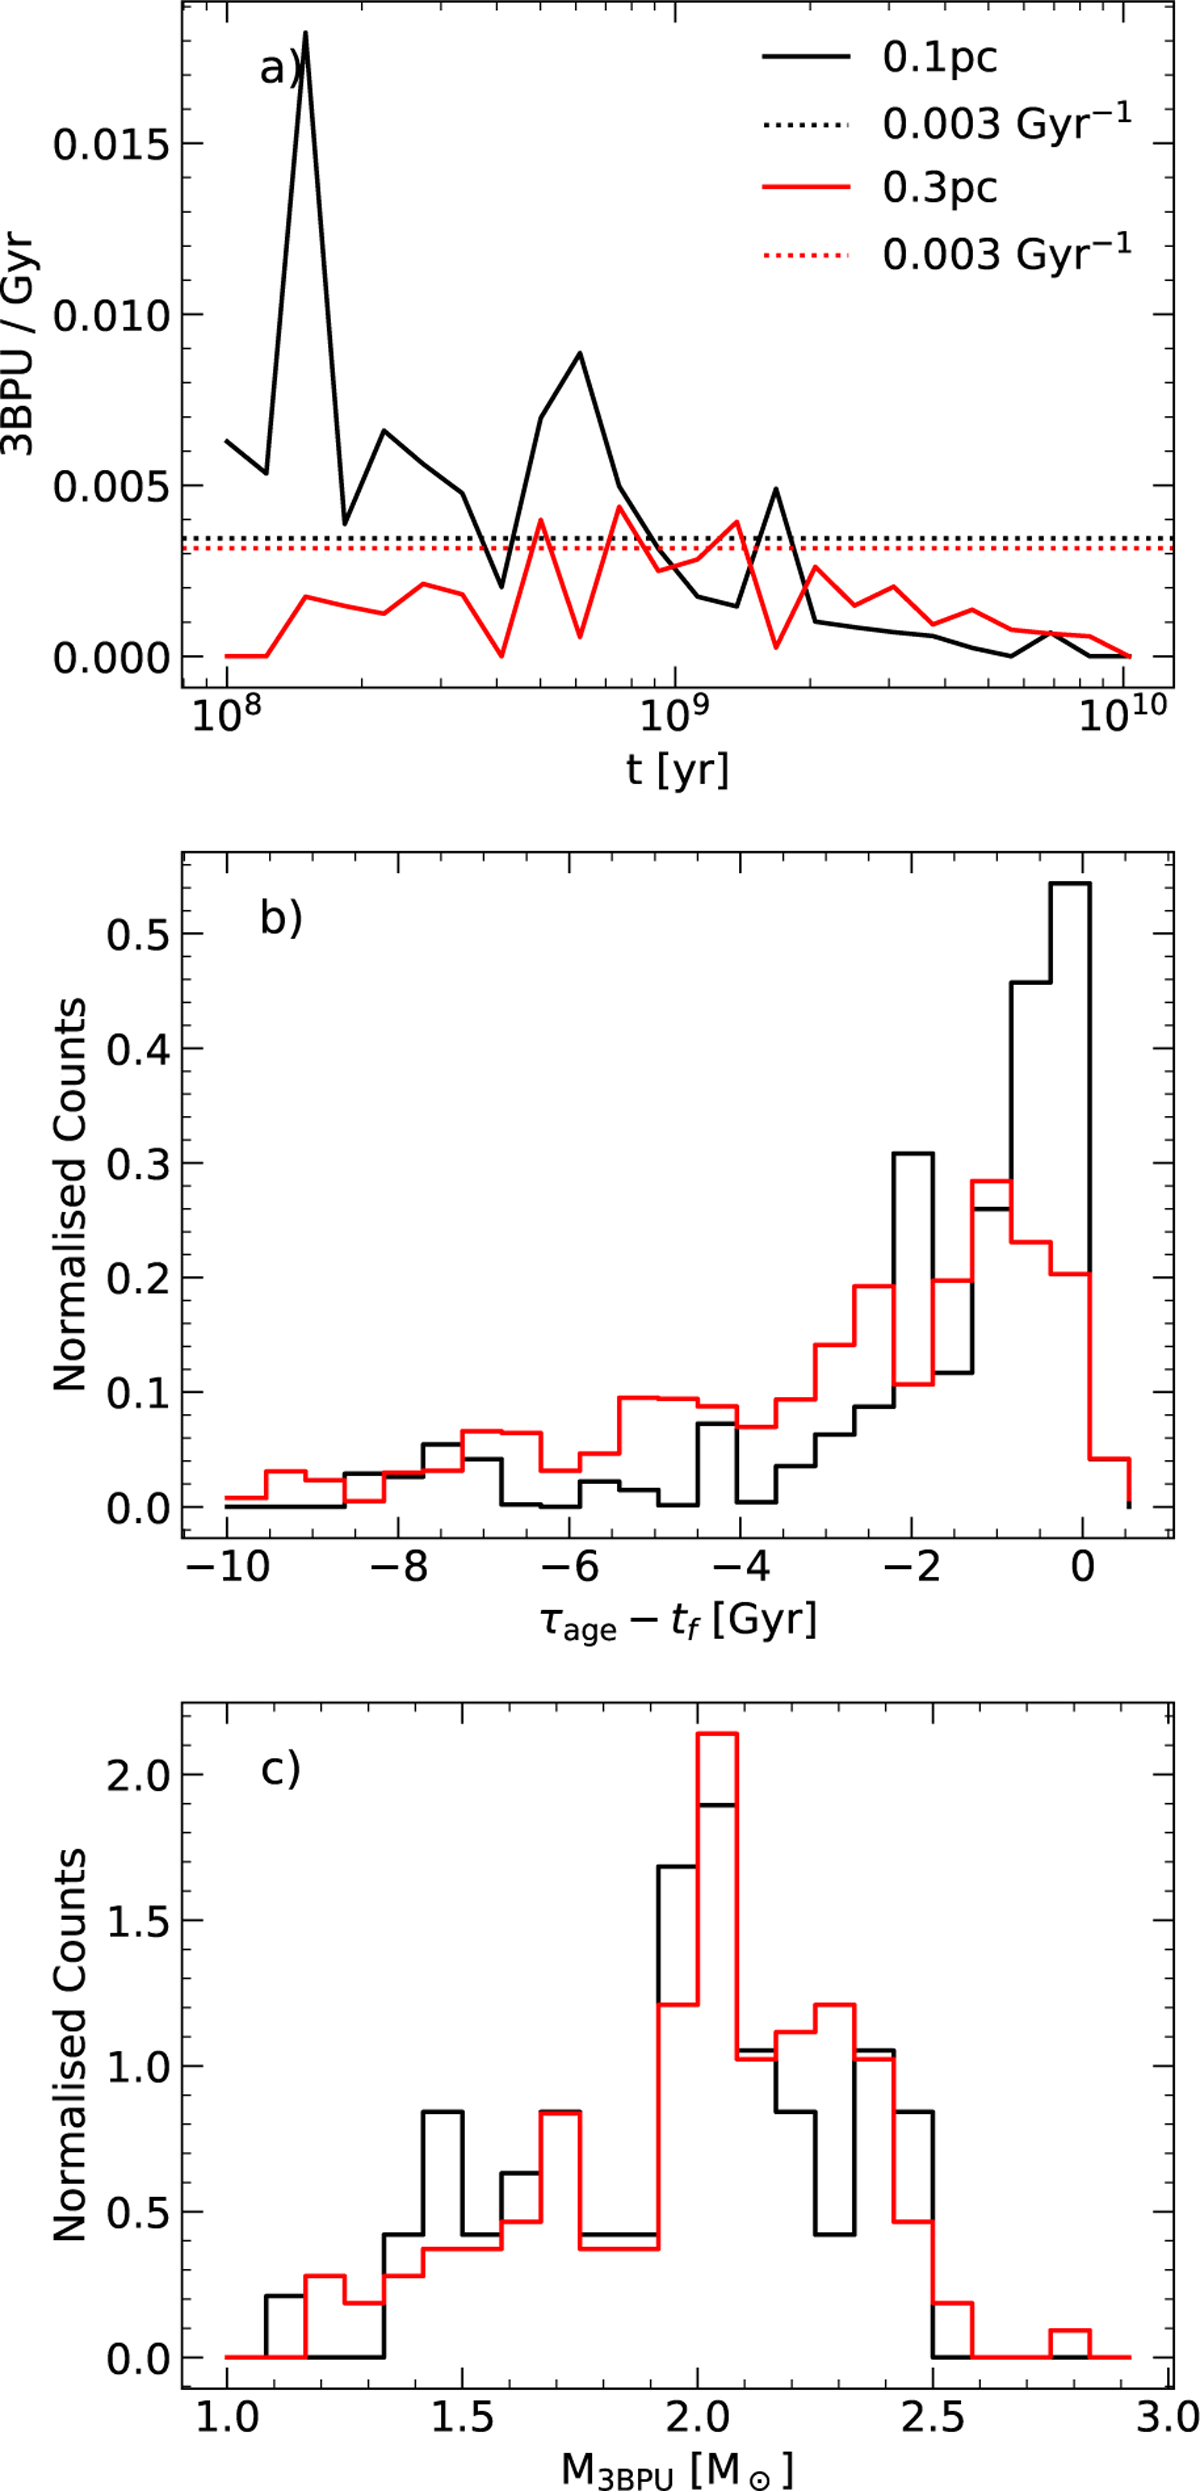
Panel a: rate of 3BPUs as a function of time. The dotted lines correspond to the mean rates over a 10 Gyr period. Panel b: normalised distribution of the estimated apparent age for the 3BPU merger products. The apparent age is determined by mapping the Helium-core mass fraction of the primary at the time of the merger to the corresponding age a normal star with the mass of the merger product would be with an identical Helium-core mass fraction. Panel c: normalised distributions of the total masses of the 3BPU merger products. For all panels, binaries originating at 0.1 pc are shown in black, and those from 0.3 pc are in red.
Current usage metrics show cumulative count of Article Views (full-text article views including HTML views, PDF and ePub downloads, according to the available data) and Abstracts Views on Vision4Press platform.
Data correspond to usage on the plateform after 2015. The current usage metrics is available 48-96 hours after online publication and is updated daily on week days.
Initial download of the metrics may take a while.