Fig. A.1
Download original image
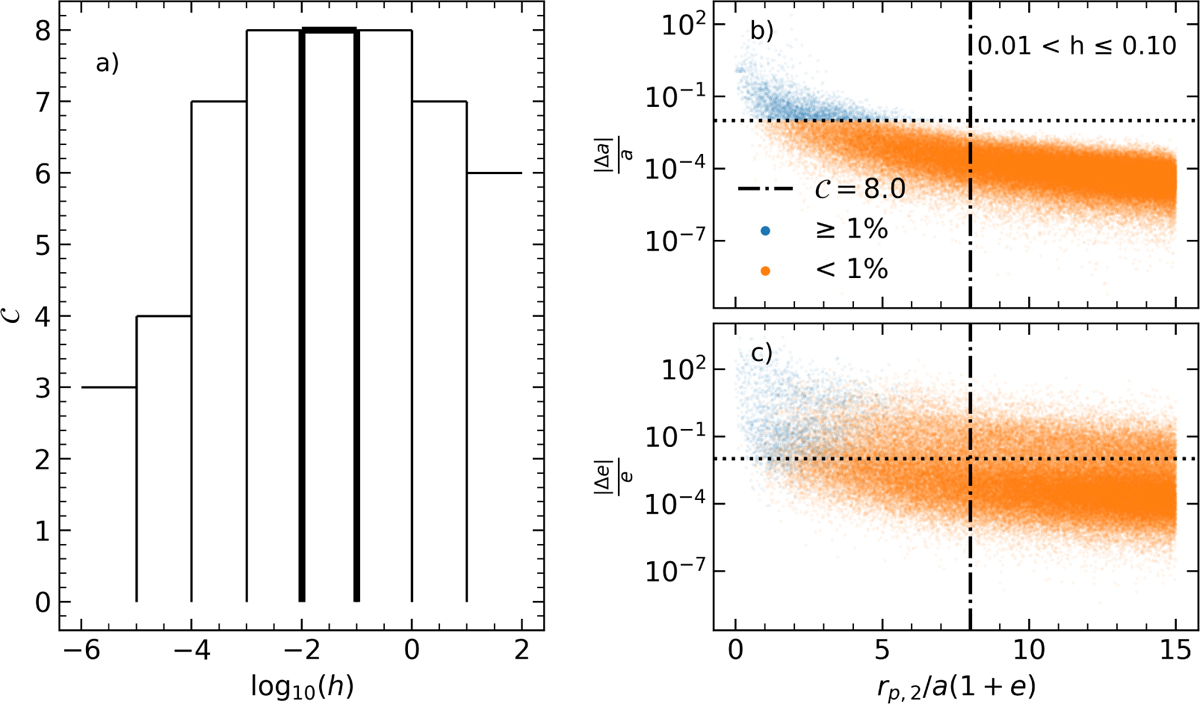
Left: Scaling parameter as a function of hardness. The edges are open to illustrate that any binary with, for example h > 10 has 𝒞 = 6. Right: Scatter plots for the fractional change in separation of binaries (top, panel b) and eccentricity (bottom, panel c), against the distance between the tertiary and binary centre-of-mass in units of the binary apoapsis. Only encounters with with a hardness of 0.01 <h≤ 0.10 are considered in this Figure. Blue (orange) dots correspond to encounters that change the binary separation with ≥ 1% (< 1%), where the black dotted lines show the 1% boundary and the black dash-dotted line the chosen value for the scaling parameter 6.
Current usage metrics show cumulative count of Article Views (full-text article views including HTML views, PDF and ePub downloads, according to the available data) and Abstracts Views on Vision4Press platform.
Data correspond to usage on the plateform after 2015. The current usage metrics is available 48-96 hours after online publication and is updated daily on week days.
Initial download of the metrics may take a while.