Fig. E.1
Download original image
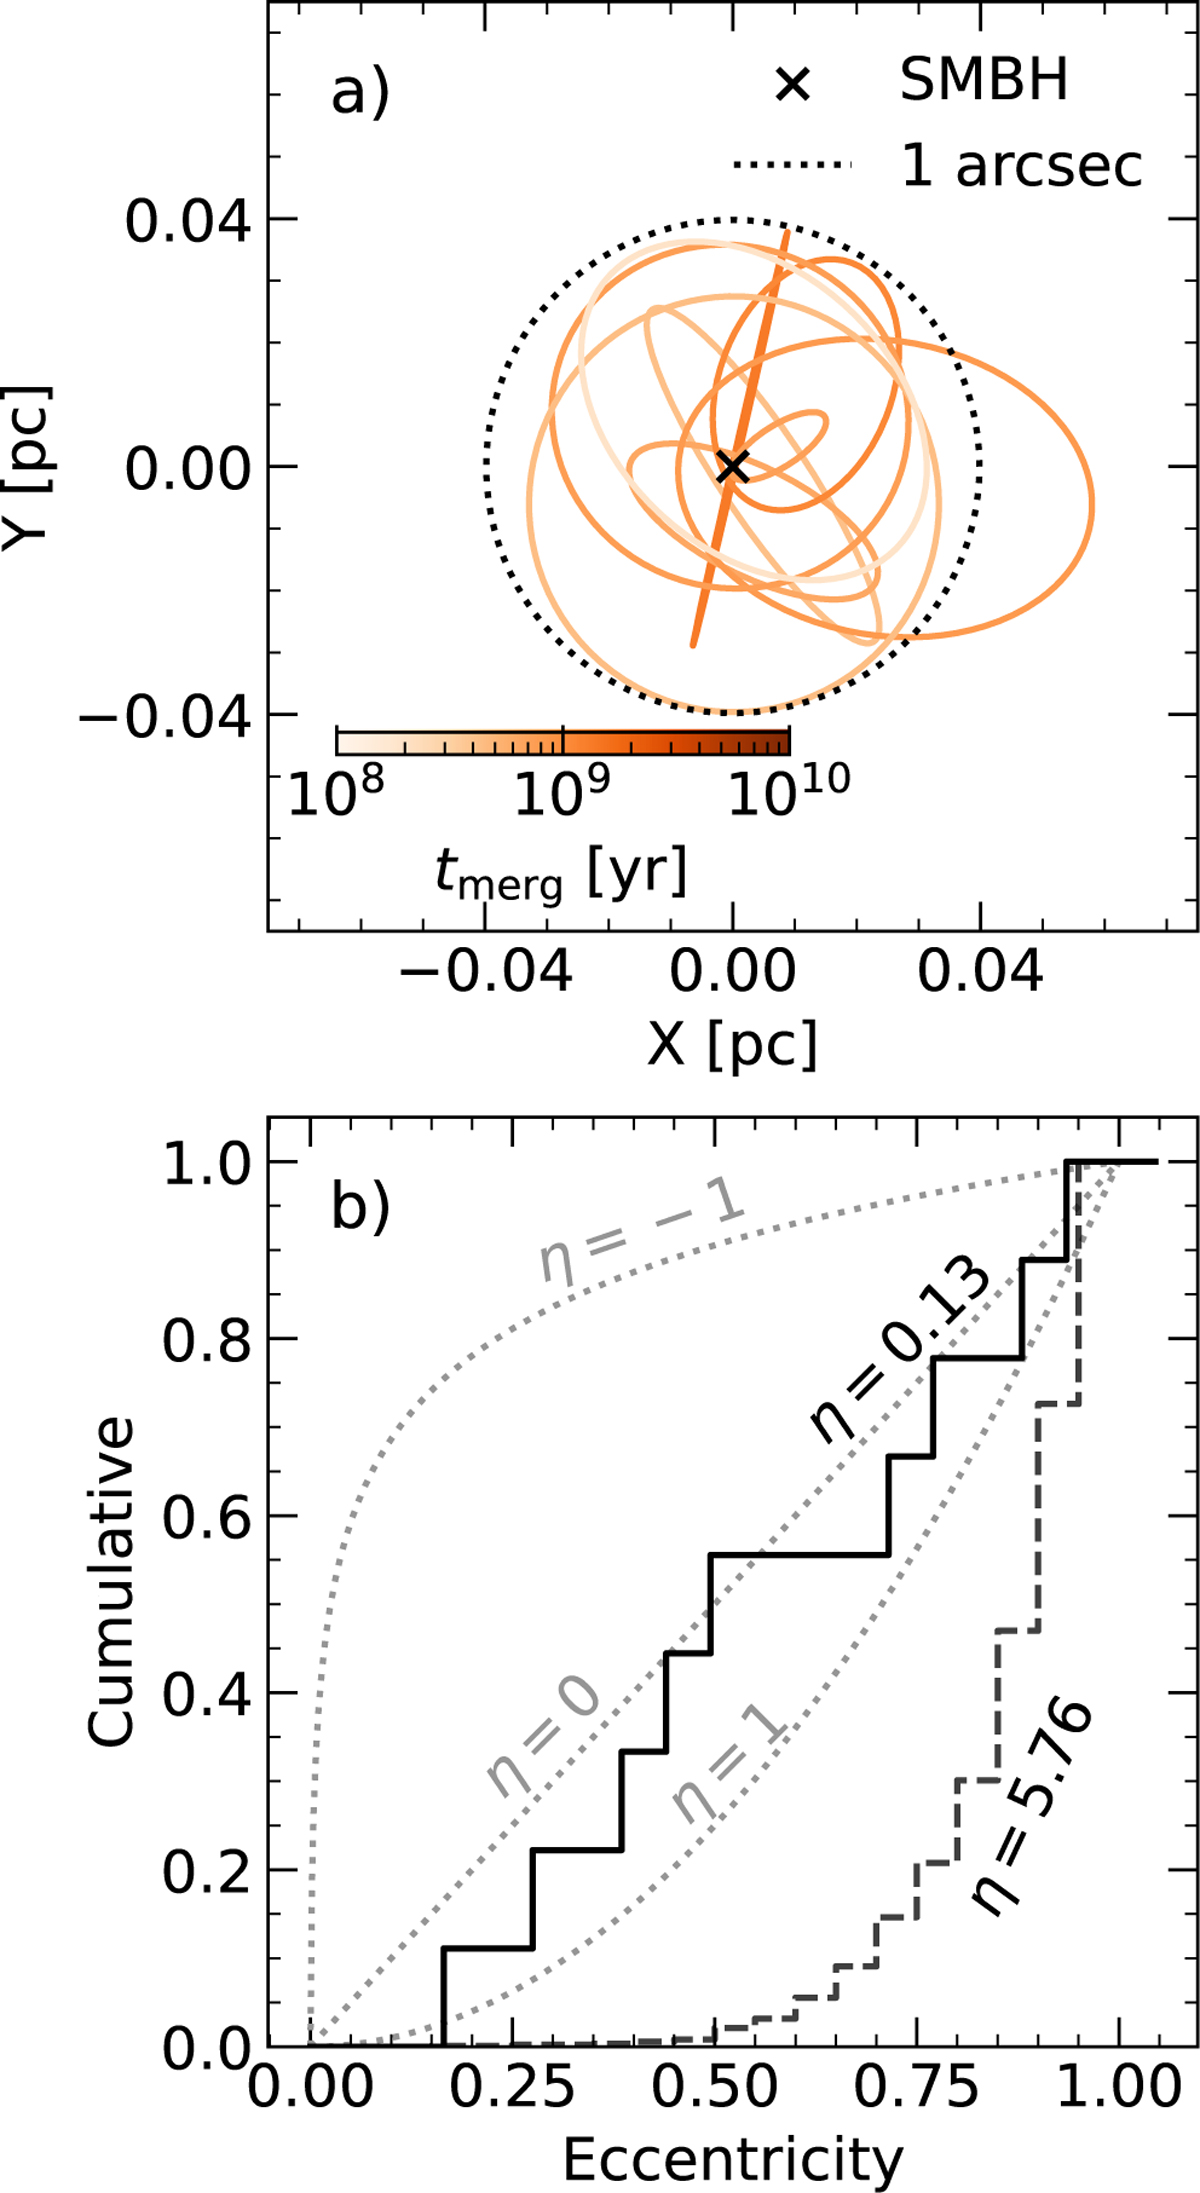
Top: Projection in 2D of the orbits of the nine merger products. The orbits are colour-coded as a function of the time of the merger. The black cross in the origin corresponds to the SMBH, and the dotted line marks the inner arcsec. Bottom: Cumulative distribution of the merger products’ eccentricities around the SMBH (similar to Figure 5). The solid black line corresponds to the merger orbits seen in the top panel, while the dashed black line corresponds to all mergers with a periapsis a(1 − e) ≤ 0.04 pc.
Current usage metrics show cumulative count of Article Views (full-text article views including HTML views, PDF and ePub downloads, according to the available data) and Abstracts Views on Vision4Press platform.
Data correspond to usage on the plateform after 2015. The current usage metrics is available 48-96 hours after online publication and is updated daily on week days.
Initial download of the metrics may take a while.