Fig. 3
Download original image
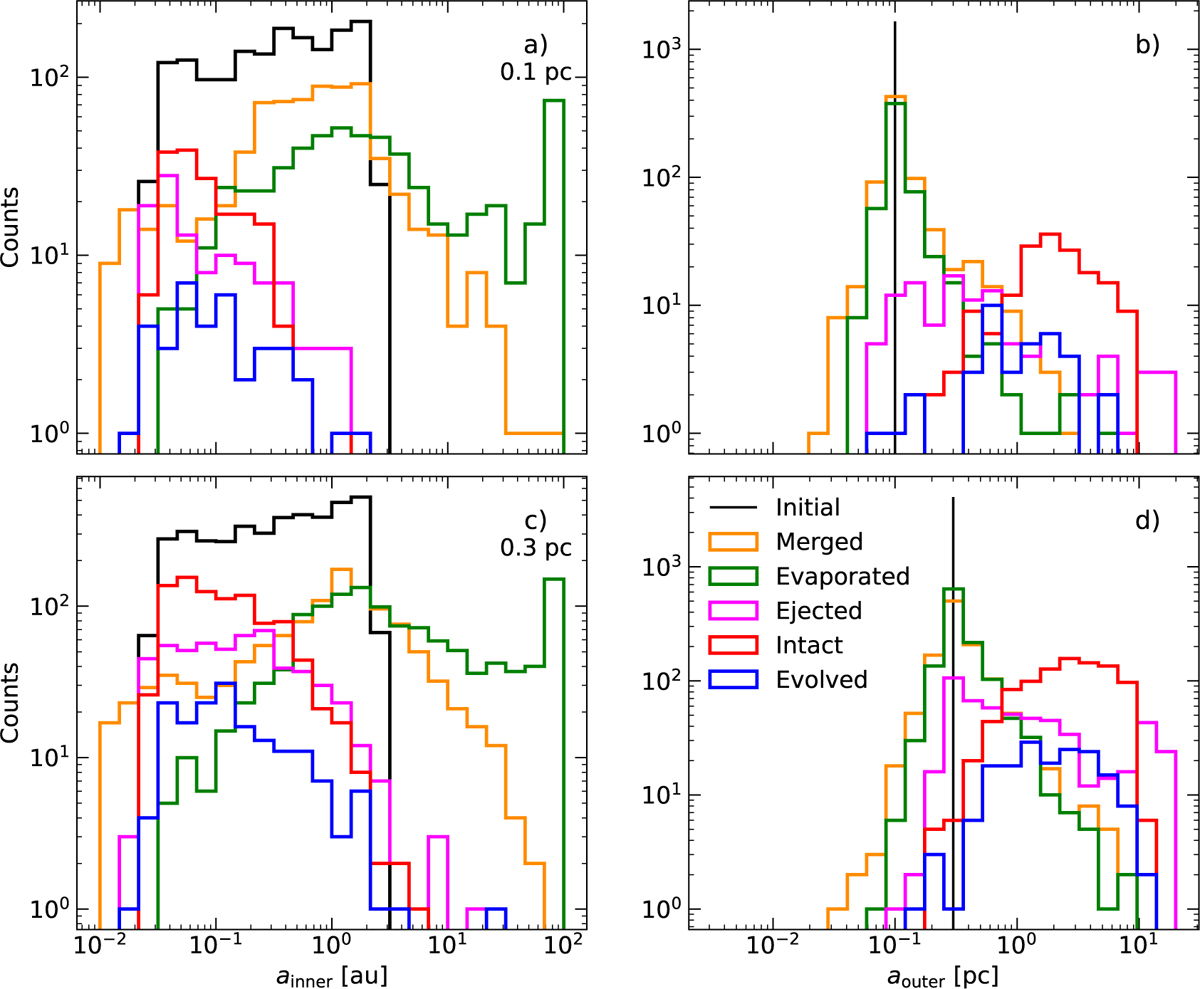
Left: inner semi-major axis distribution of the initial population (black) and the corresponding final outcomes (colours). Yellow lines refer to binary mergers, green lines to binaries that evaporate, magenta lines to binaries that are ejected (unbound from the SMBH), red lines to intact binaries (i.e. binaries that survive to 10 Gyr), and blue lines to evolved binaries (stellar evolution of the primary occurs before binary destruction and by 10 Gyr). In the cases of evaporation and mergers, the properties shown in the figure refer to the binary just before either destruction mechanism takes place. Ejection corresponds to the region the binaries were ejected from and not where they end up. The top row corresponds to binaries starting with a• = 0.1 pc from the SMBH, while the bottom row corresponds to a• = 0.3 pc. Right: outer semi-major axis distributions. The vertical black lines represent the initial populations, and the boxes of the final outcomes are coloured in the same way as in the left panel.
Current usage metrics show cumulative count of Article Views (full-text article views including HTML views, PDF and ePub downloads, according to the available data) and Abstracts Views on Vision4Press platform.
Data correspond to usage on the plateform after 2015. The current usage metrics is available 48-96 hours after online publication and is updated daily on week days.
Initial download of the metrics may take a while.