Fig. 5
Download original image
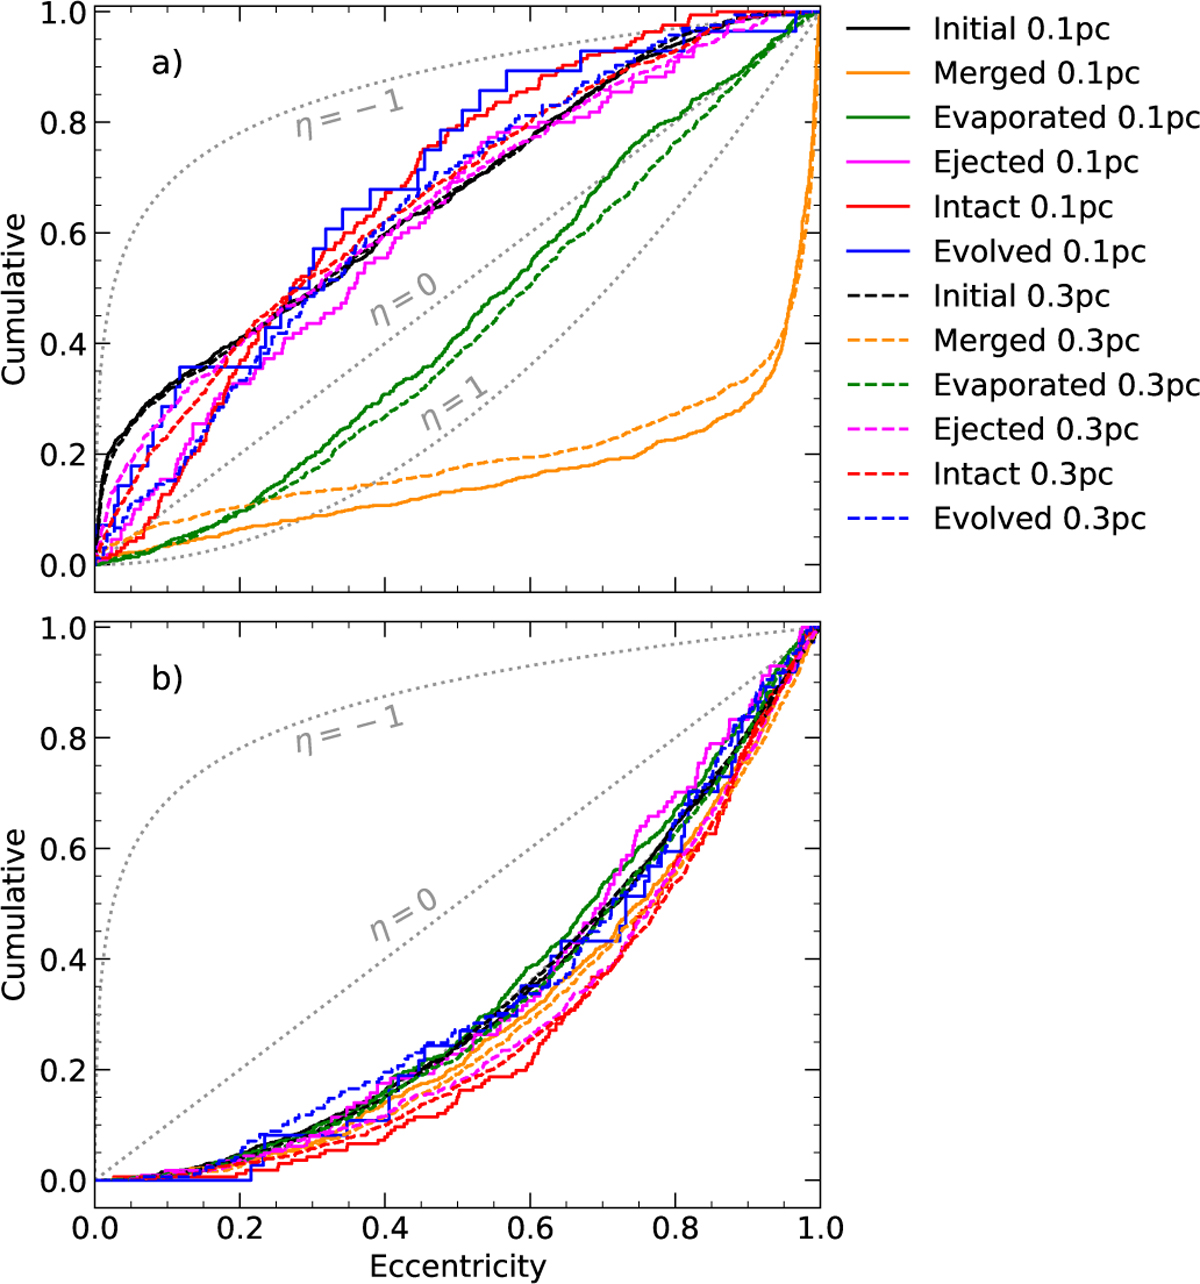
Cumulative distribution of the eccentricities for the inner (panel a) and outer (panel b) orbit, colour-coded as in the previous figures (outcome). The dotted grey lines follow specific power-law distribution eη where η = −1 correspond to mostly circular orbits, η = 0 to a uniform distribution and η = 1 to a thermal distribution (e.g. mostly eccentric orbits). As in Figure 3, the coloured distributions consider the final state of a binary where it can still be considered a binary (and not destroyed). Best-fit parameters can be found in Table C.1.
Current usage metrics show cumulative count of Article Views (full-text article views including HTML views, PDF and ePub downloads, according to the available data) and Abstracts Views on Vision4Press platform.
Data correspond to usage on the plateform after 2015. The current usage metrics is available 48-96 hours after online publication and is updated daily on week days.
Initial download of the metrics may take a while.