Fig. 6
Download original image
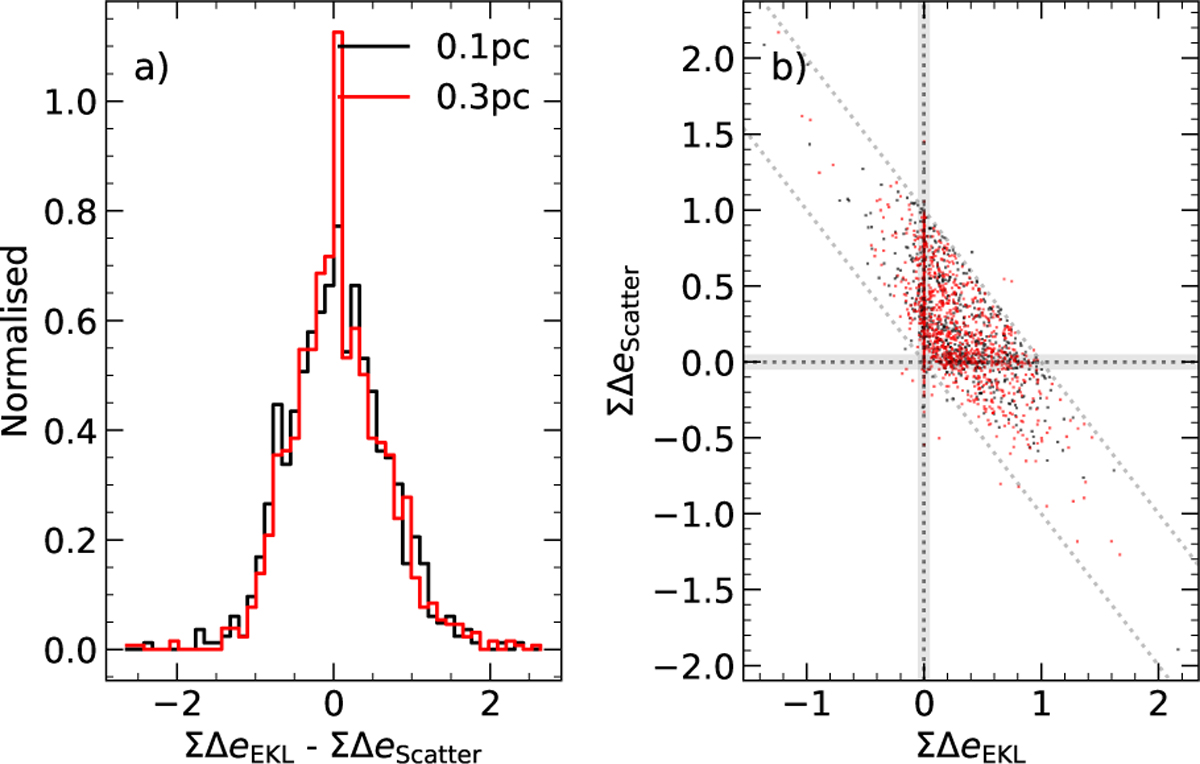
Panel a: distribution of the differences between changes in eccentricity due to ZLK and due to repeated scatters (only looking at binaries that eventually merge). The black line corresponds to binaries initially 0.1 pc away from the SMBH and the red line to 0.3 pc. Panel b: scatter of these two terms. One point corresponds to one binary. The zero-lines are shown as dotted black lines, and the shaded areas correspond to the ±0.05 region around the zero-lines. The two diagonal lines show x + y = 0 (lower) and x + y = 1 (upper).
Current usage metrics show cumulative count of Article Views (full-text article views including HTML views, PDF and ePub downloads, according to the available data) and Abstracts Views on Vision4Press platform.
Data correspond to usage on the plateform after 2015. The current usage metrics is available 48-96 hours after online publication and is updated daily on week days.
Initial download of the metrics may take a while.