Fig. 7
Download original image
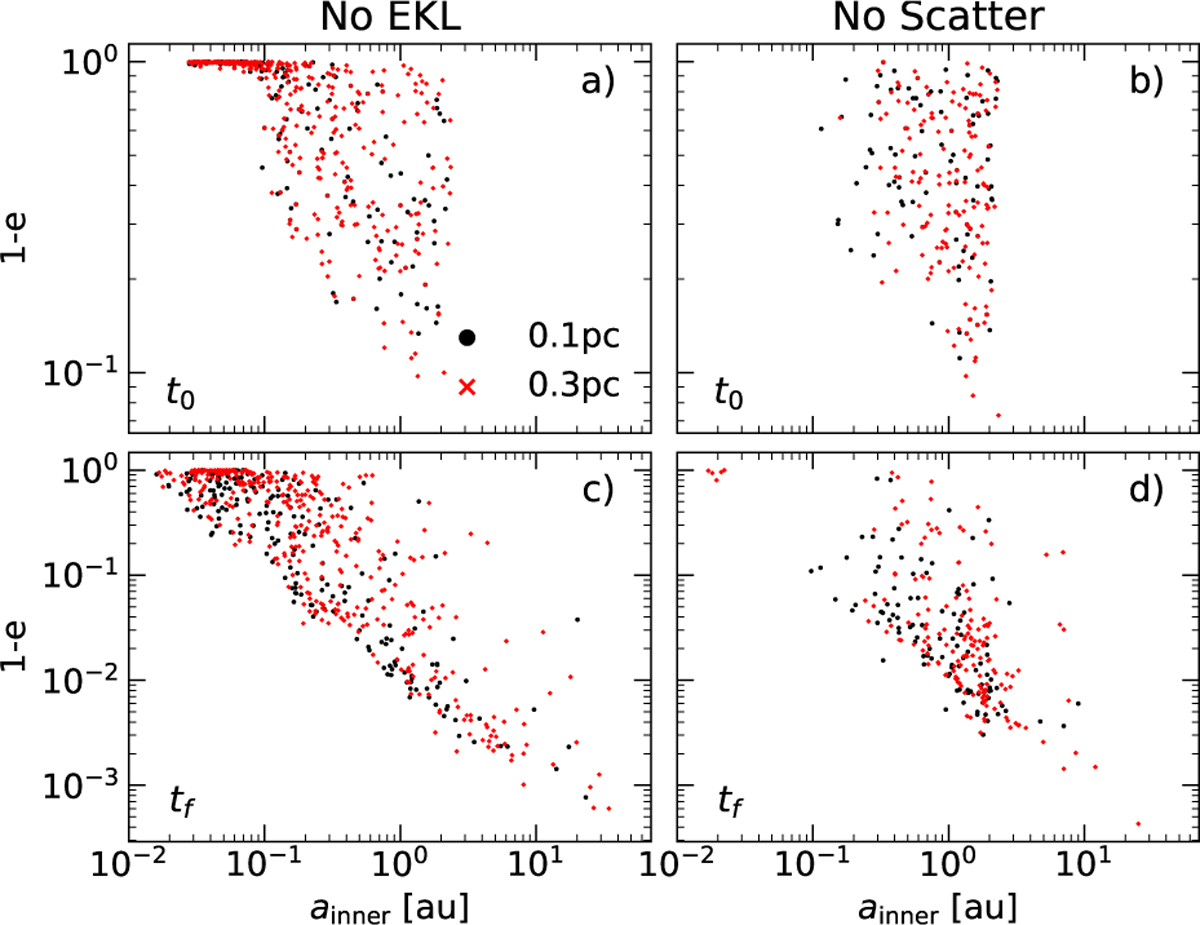
Four-panel plot showing the separation versus 1 − e of the inner orbit. Based on the zero-lines in Figure 6. The left-hand side column corresponds to the vertical zero-line (|ΣΔeZLK| ≤ 0.05), and the right-hand side column corresponds to the horizontal zero-line (|ΣΔeScatterl ≤ 0.05). The top row shows the initial distribution at t = 0, while the bottom row shows the final distribution at t = tf before the binaries merge.
Current usage metrics show cumulative count of Article Views (full-text article views including HTML views, PDF and ePub downloads, according to the available data) and Abstracts Views on Vision4Press platform.
Data correspond to usage on the plateform after 2015. The current usage metrics is available 48-96 hours after online publication and is updated daily on week days.
Initial download of the metrics may take a while.