Open Access
Fig. 8
Download original image
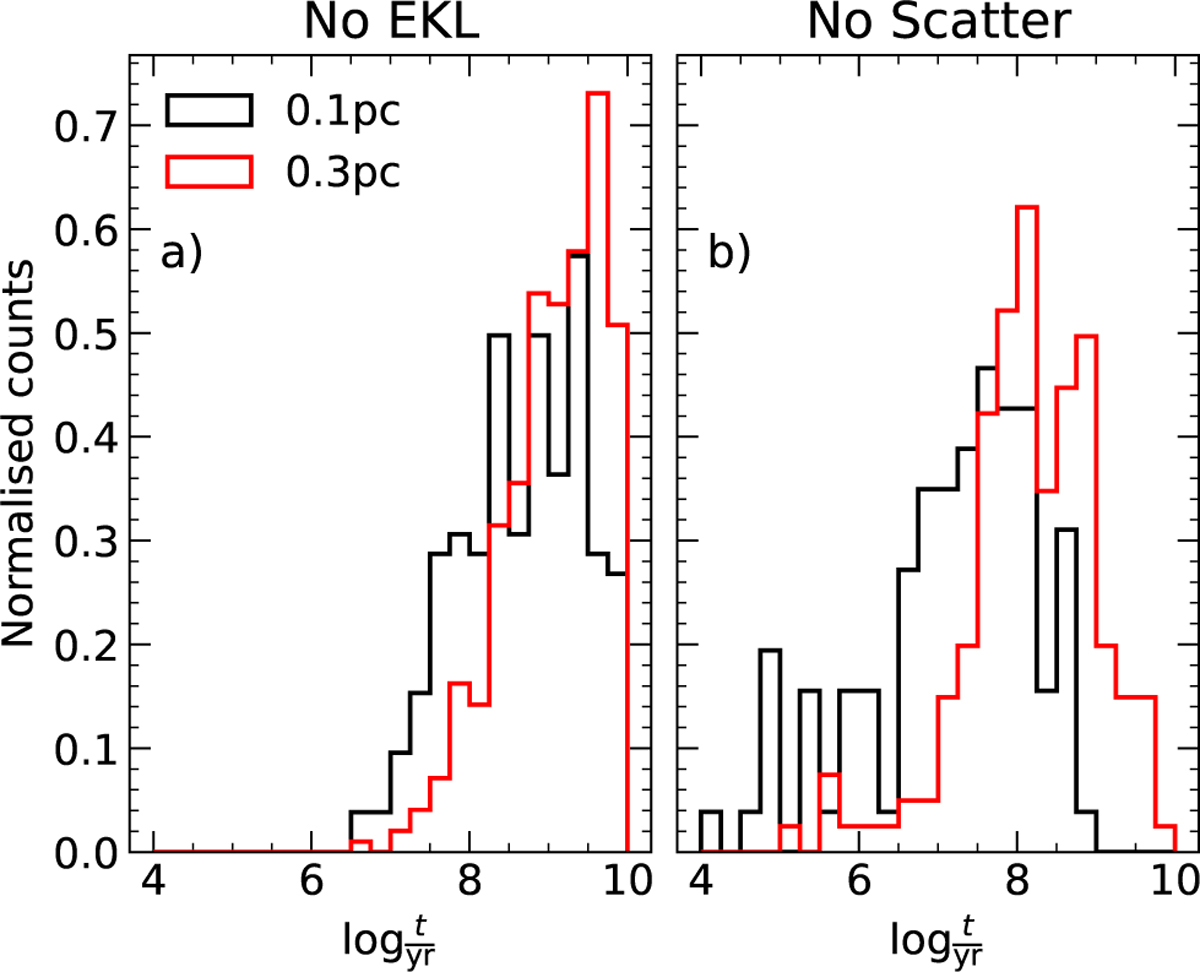
Time of merger distribution for the binaries in Figure 7. Panel a, as before, refers to the vertical zero-line (effectively no ZLK) in Figure 6, while panel b refers to the horizontal zero-line (effectively no scatters). The black (red) line is for binaries initially at 0.1 pc (0.3 pc) away from the SMBH.
Current usage metrics show cumulative count of Article Views (full-text article views including HTML views, PDF and ePub downloads, according to the available data) and Abstracts Views on Vision4Press platform.
Data correspond to usage on the plateform after 2015. The current usage metrics is available 48-96 hours after online publication and is updated daily on week days.
Initial download of the metrics may take a while.