Fig. 9
Download original image
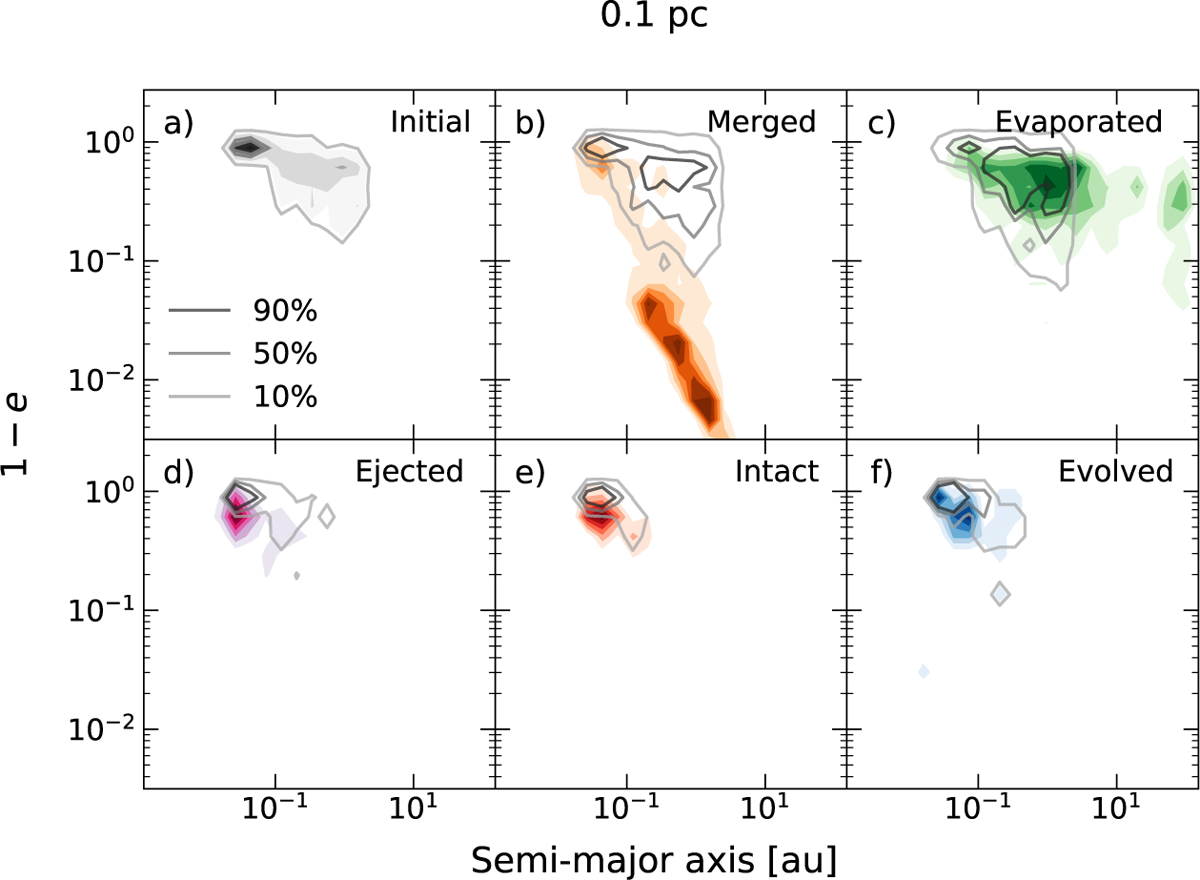
Contours of the inner semi-major axis versus 1 − e for various outcomes at 0.1 pc from the SMBH. Upper row, from the left, initial distribution in black (a), merged binaries in orange (b), and evaporated binaries in green (c). Bottom row, from the left, the intact population (after 10 Gyr) in red (d), the evolved population in blue (e), and ejected binaries in magenta (f). For panels (b), (c), and (d), the distribution refers to the binary’s properties the moment just before the final outcome.
Current usage metrics show cumulative count of Article Views (full-text article views including HTML views, PDF and ePub downloads, according to the available data) and Abstracts Views on Vision4Press platform.
Data correspond to usage on the plateform after 2015. The current usage metrics is available 48-96 hours after online publication and is updated daily on week days.
Initial download of the metrics may take a while.