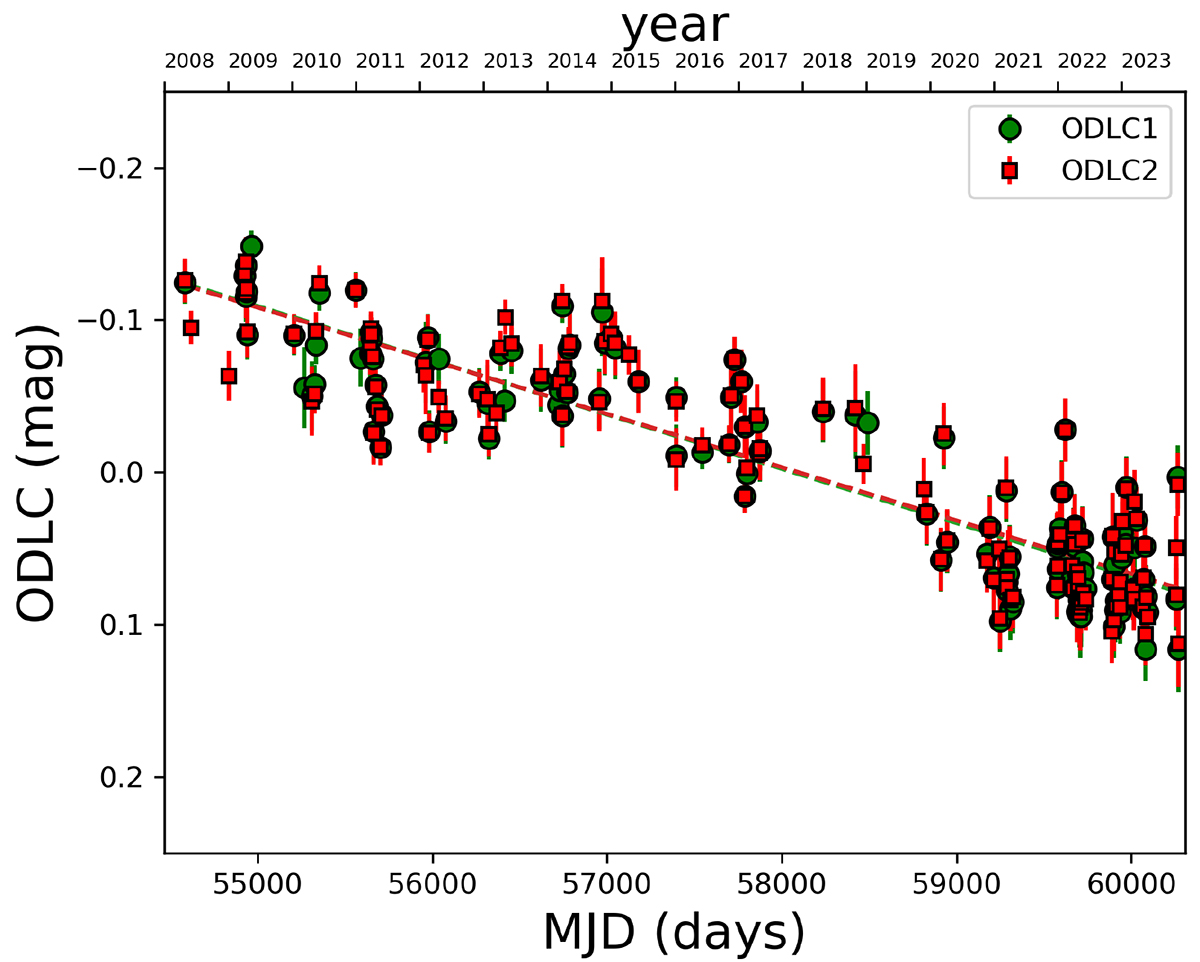
Fig. 1.
Download original image
Observed difference light curves of FBQ 0951+2635 in the r band. They are built from time-delay values of 16 d (ODLC1) and 13.3 d (ODLC2). For each delay, the light curve of A is time shifted, and its shifted magnitudes around the dates in B were interpolated and subtracted from the magnitudes of B. The final step is to subtract the average magnitude difference. We also show two linear fits (green and red dashed lines) to the observed microlensing signals (although they can barely be distinguished from each other in the plot).
Current usage metrics show cumulative count of Article Views (full-text article views including HTML views, PDF and ePub downloads, according to the available data) and Abstracts Views on Vision4Press platform.
Data correspond to usage on the plateform after 2015. The current usage metrics is available 48-96 hours after online publication and is updated daily on week days.
Initial download of the metrics may take a while.