Open Access
Fig. 4.
Download original image
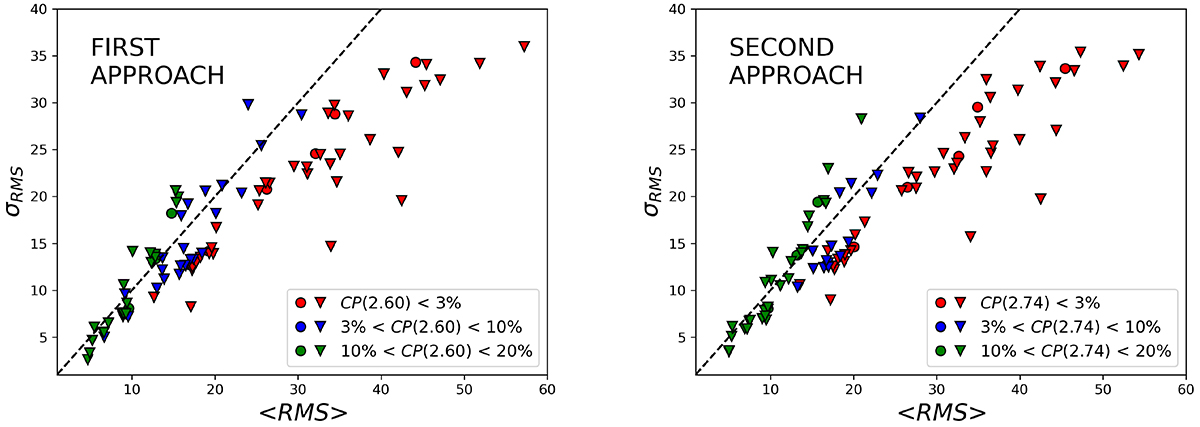
Statistical properties of RMS distributions. For each approach in Table 1, we display the ⟨RMS⟩ and σRMS values associated with nine standard (circles) and 81 non-standard (triangles) physical scenarios. Three intervals of consistency probability are also highlighted in red, blue, and green (see the main text).
Current usage metrics show cumulative count of Article Views (full-text article views including HTML views, PDF and ePub downloads, according to the available data) and Abstracts Views on Vision4Press platform.
Data correspond to usage on the plateform after 2015. The current usage metrics is available 48-96 hours after online publication and is updated daily on week days.
Initial download of the metrics may take a while.