Fig. 5.
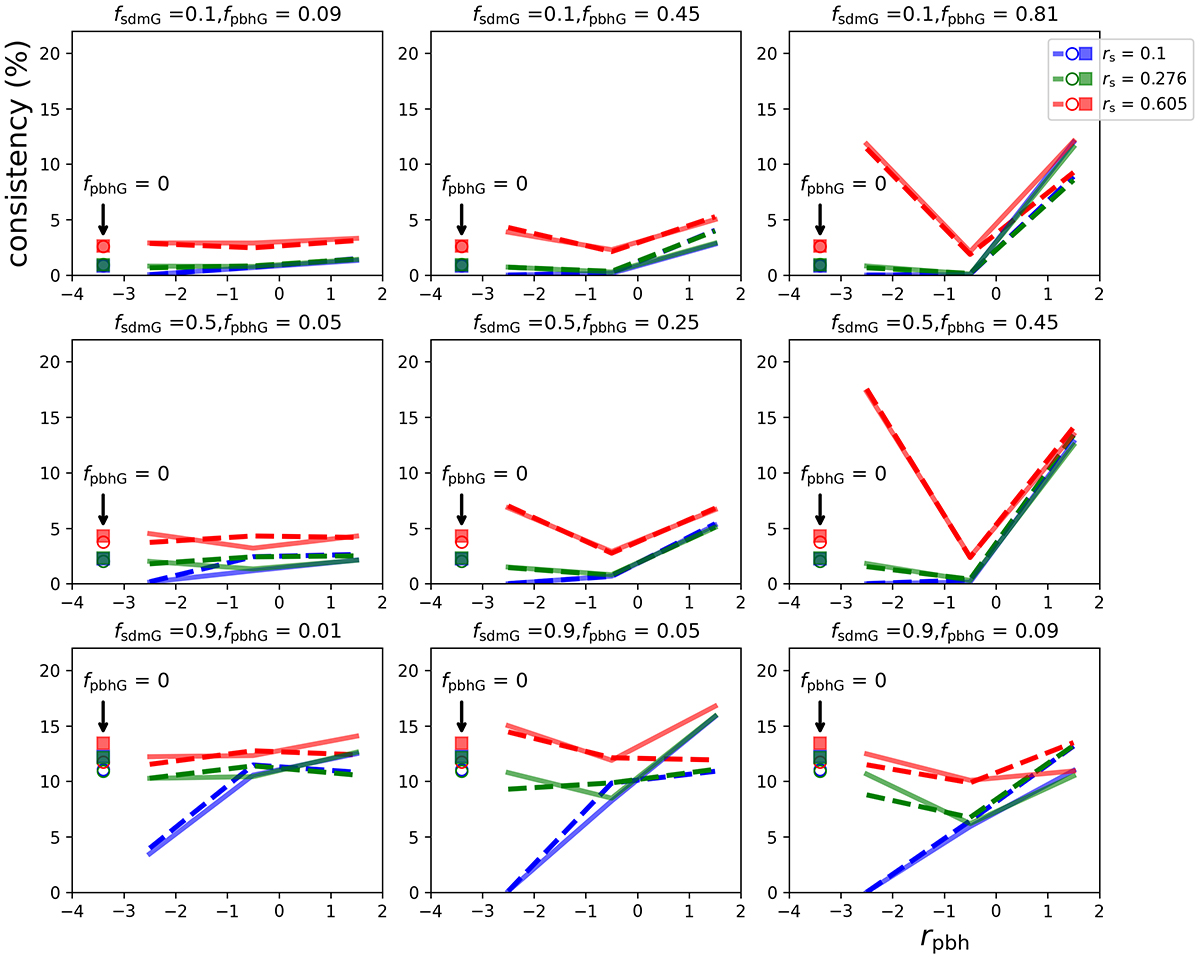
Download original image
Consistency probability between observed slow extrinsic variability and simulated microlensing signals in relevant physical scenarios. The open circles (standard scenarios) and dashed lines (non-standard scenarios) represent the results from the first approach, and the filled squares (standard scenarios) and solid lines (non-standard scenarios) indicate the results using the second approach. The x-axis represents the logarithm of the Mpbh/Mstar ratio and includes the three values used in the non-standard scenarios; i.e. rpbh = −2.5, −0.5, and 1.5. We arbitrarily put the results for the standard scenarios at rpbh = −3.4 for a better visual comparison. The source size is highlighted in blue, green, and red (see the main text).
Current usage metrics show cumulative count of Article Views (full-text article views including HTML views, PDF and ePub downloads, according to the available data) and Abstracts Views on Vision4Press platform.
Data correspond to usage on the plateform after 2015. The current usage metrics is available 48-96 hours after online publication and is updated daily on week days.
Initial download of the metrics may take a while.