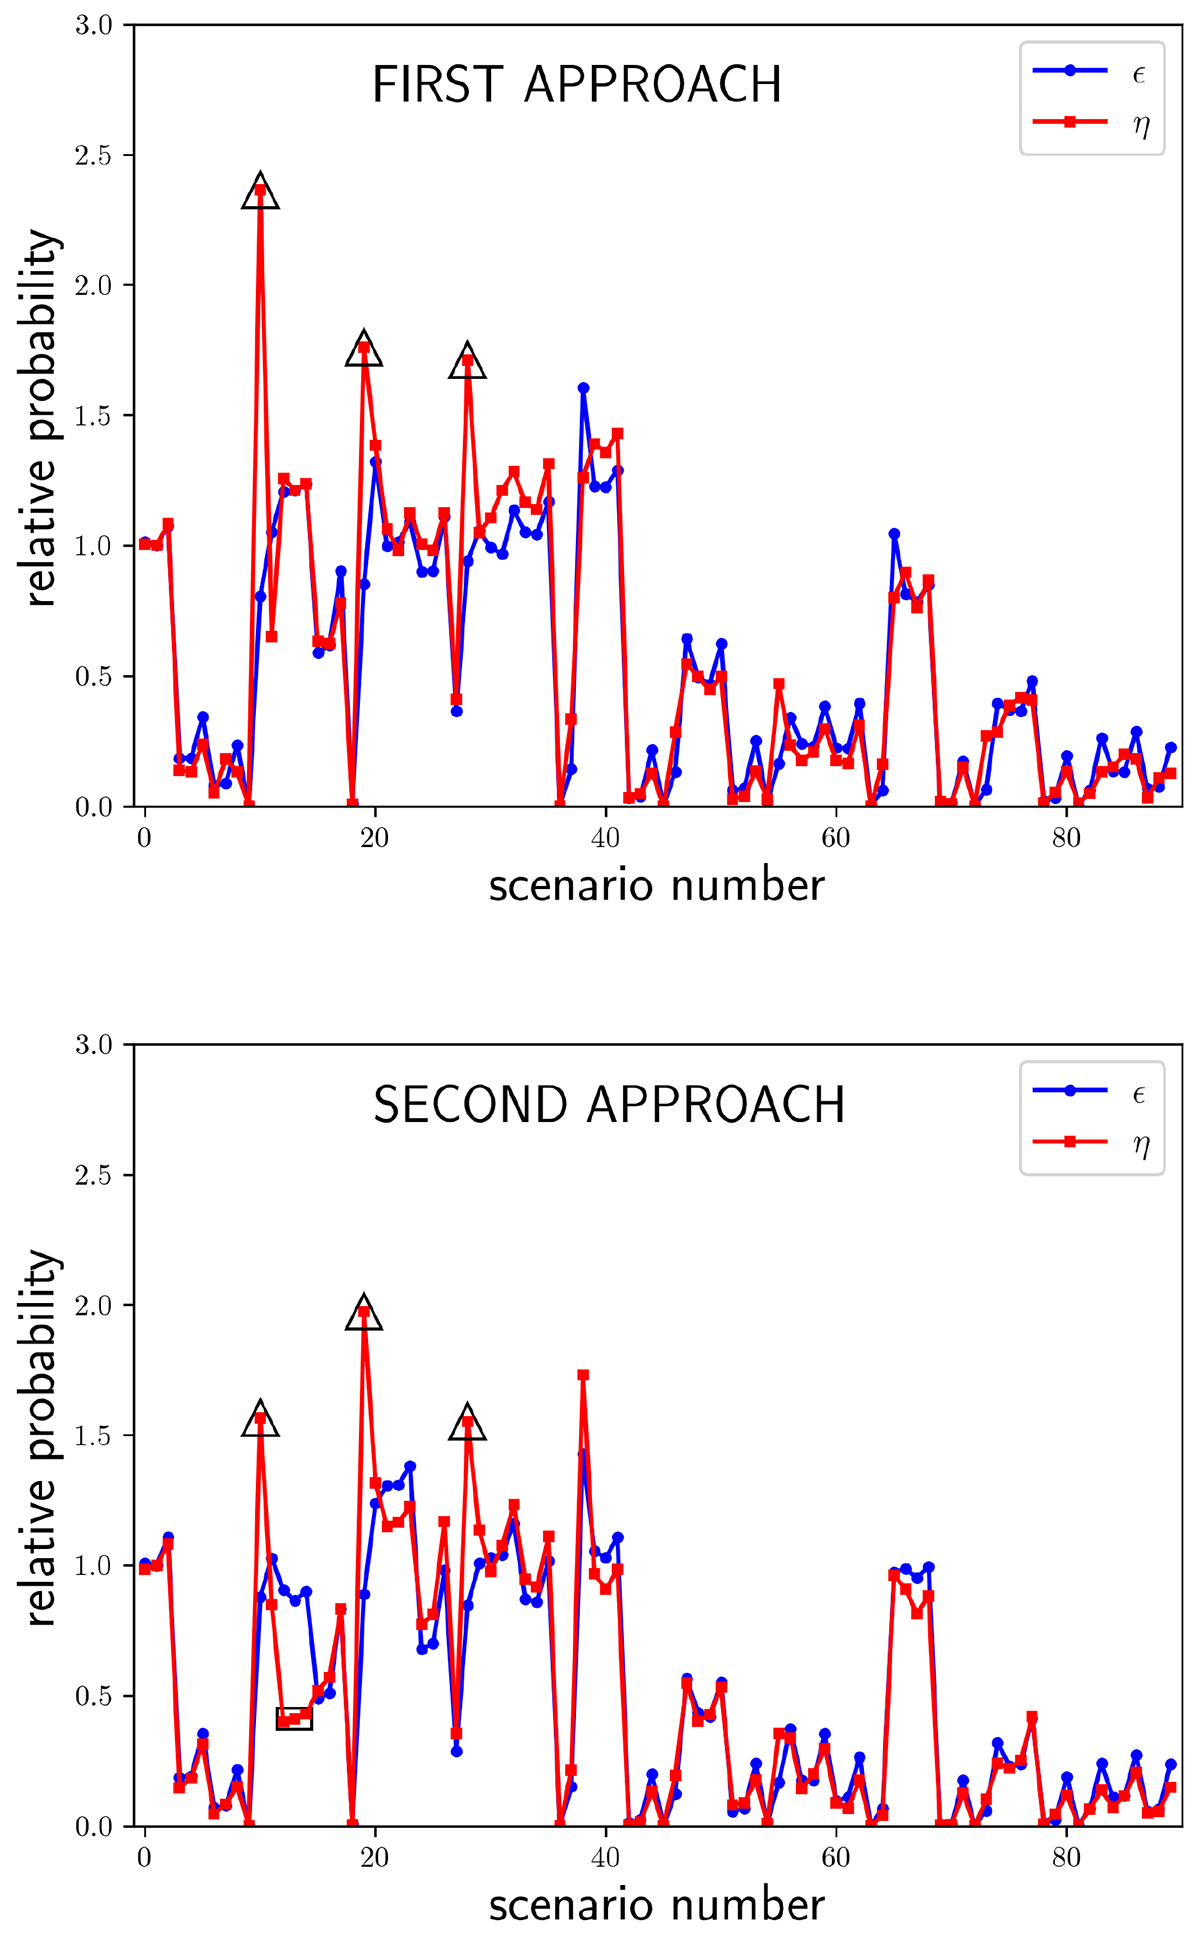
Fig. B.1.
Download original image
Relative probabilities from two different metrics. Considering the two approaches in Table 1, we compare the values of ϵ and η for each of the 90 physical scenarios summarised in Appendix A. The values of η for the same three scenarios in both approaches are highlighted with black triangles. We also use a black rectangle to highlight the values of η for three other scenarios in the second approach (see the main text).
Current usage metrics show cumulative count of Article Views (full-text article views including HTML views, PDF and ePub downloads, according to the available data) and Abstracts Views on Vision4Press platform.
Data correspond to usage on the plateform after 2015. The current usage metrics is available 48-96 hours after online publication and is updated daily on week days.
Initial download of the metrics may take a while.