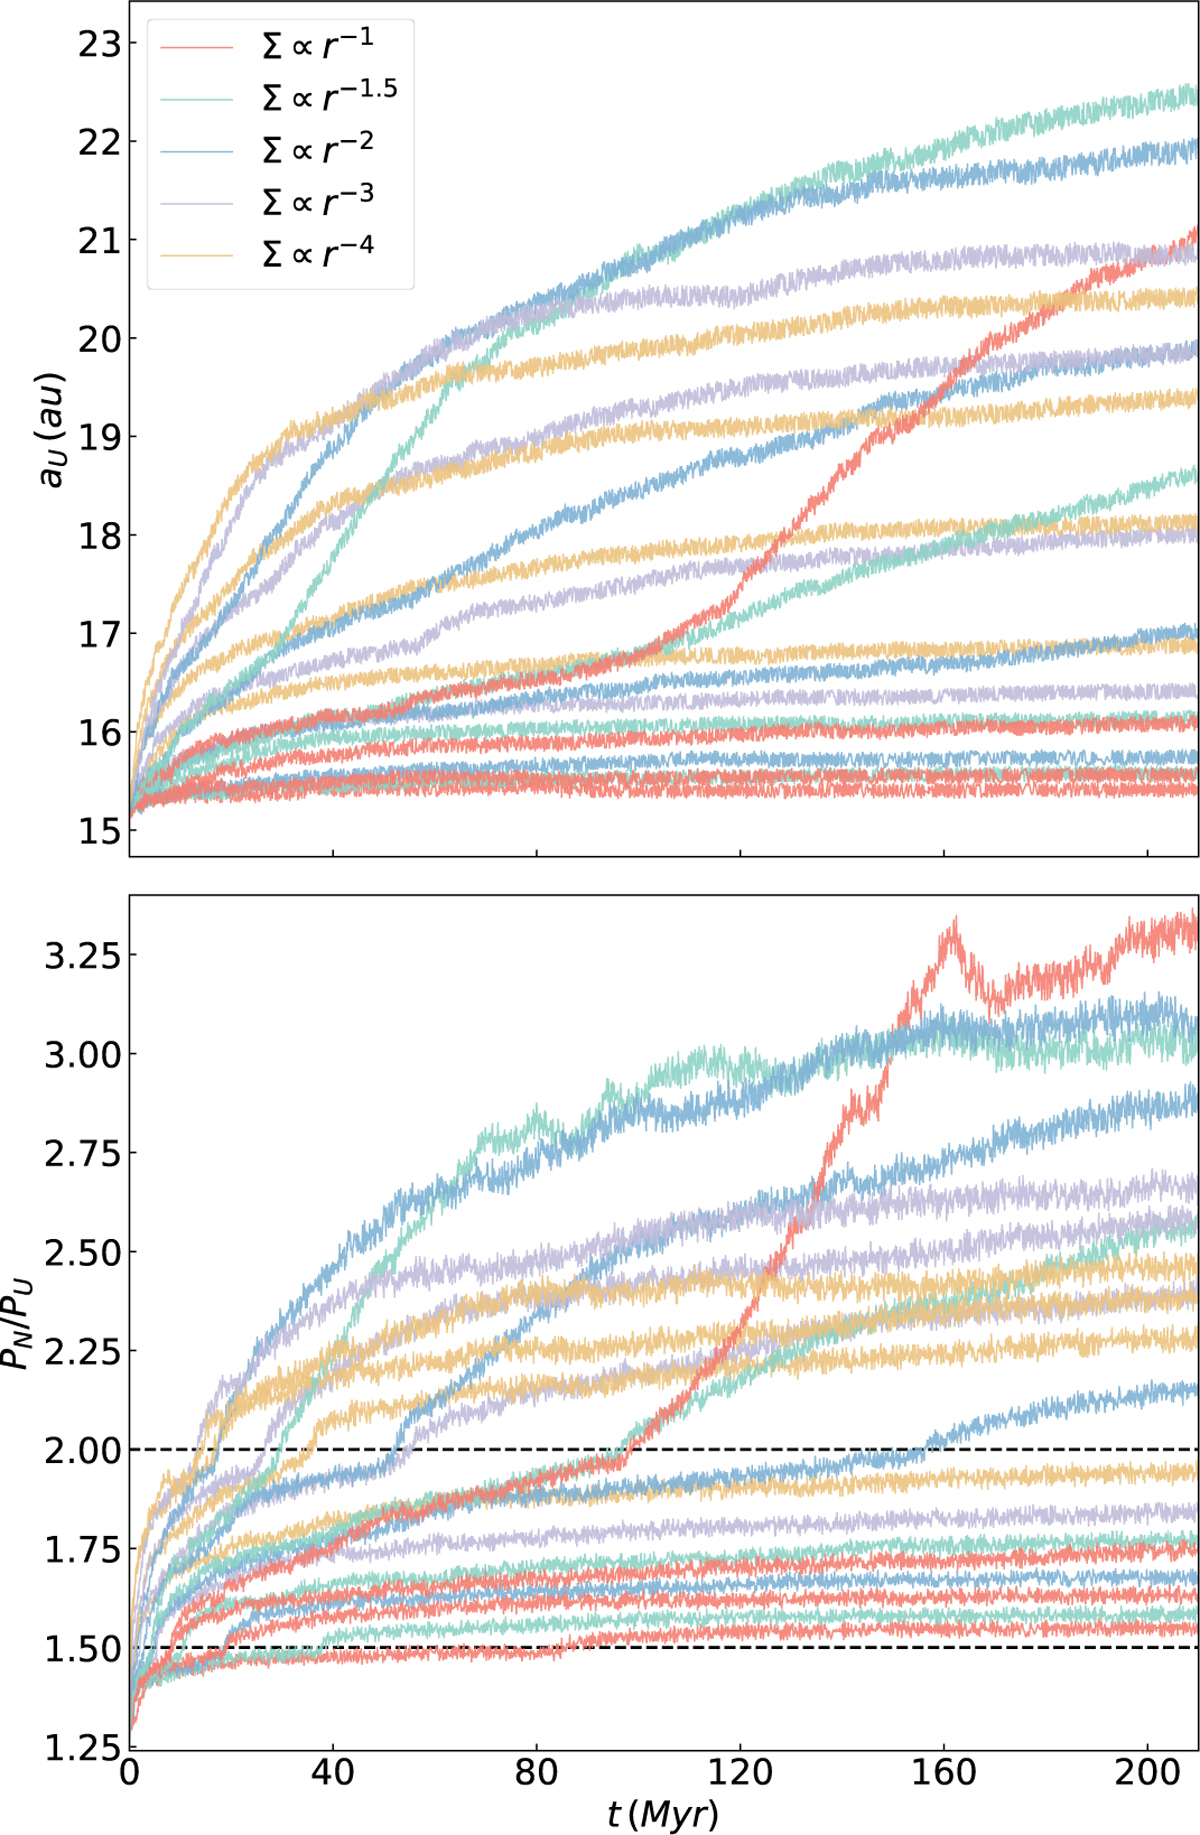
Fig. 2
Download original image
Acceleration of migration at crossing MMRs. The upper panel shows the evolution of aU, while the lower panel displays the period ratio between Neptune and Uranus. Different α are represented by different colors. The Mdisk are not explicitly distinguished, but their relative positions are fixed, with four lines of the same color representing Mdisk of 30 M⊕, 40 M⊕, 50 M⊕, and 60 M⊕ from bottom to top. In the lower panel, two dashed black lines indicate positions where the period ratio between Neptune and Uranus is 2 and 1.5.
Current usage metrics show cumulative count of Article Views (full-text article views including HTML views, PDF and ePub downloads, according to the available data) and Abstracts Views on Vision4Press platform.
Data correspond to usage on the plateform after 2015. The current usage metrics is available 48-96 hours after online publication and is updated daily on week days.
Initial download of the metrics may take a while.