Fig. 3
Download original image
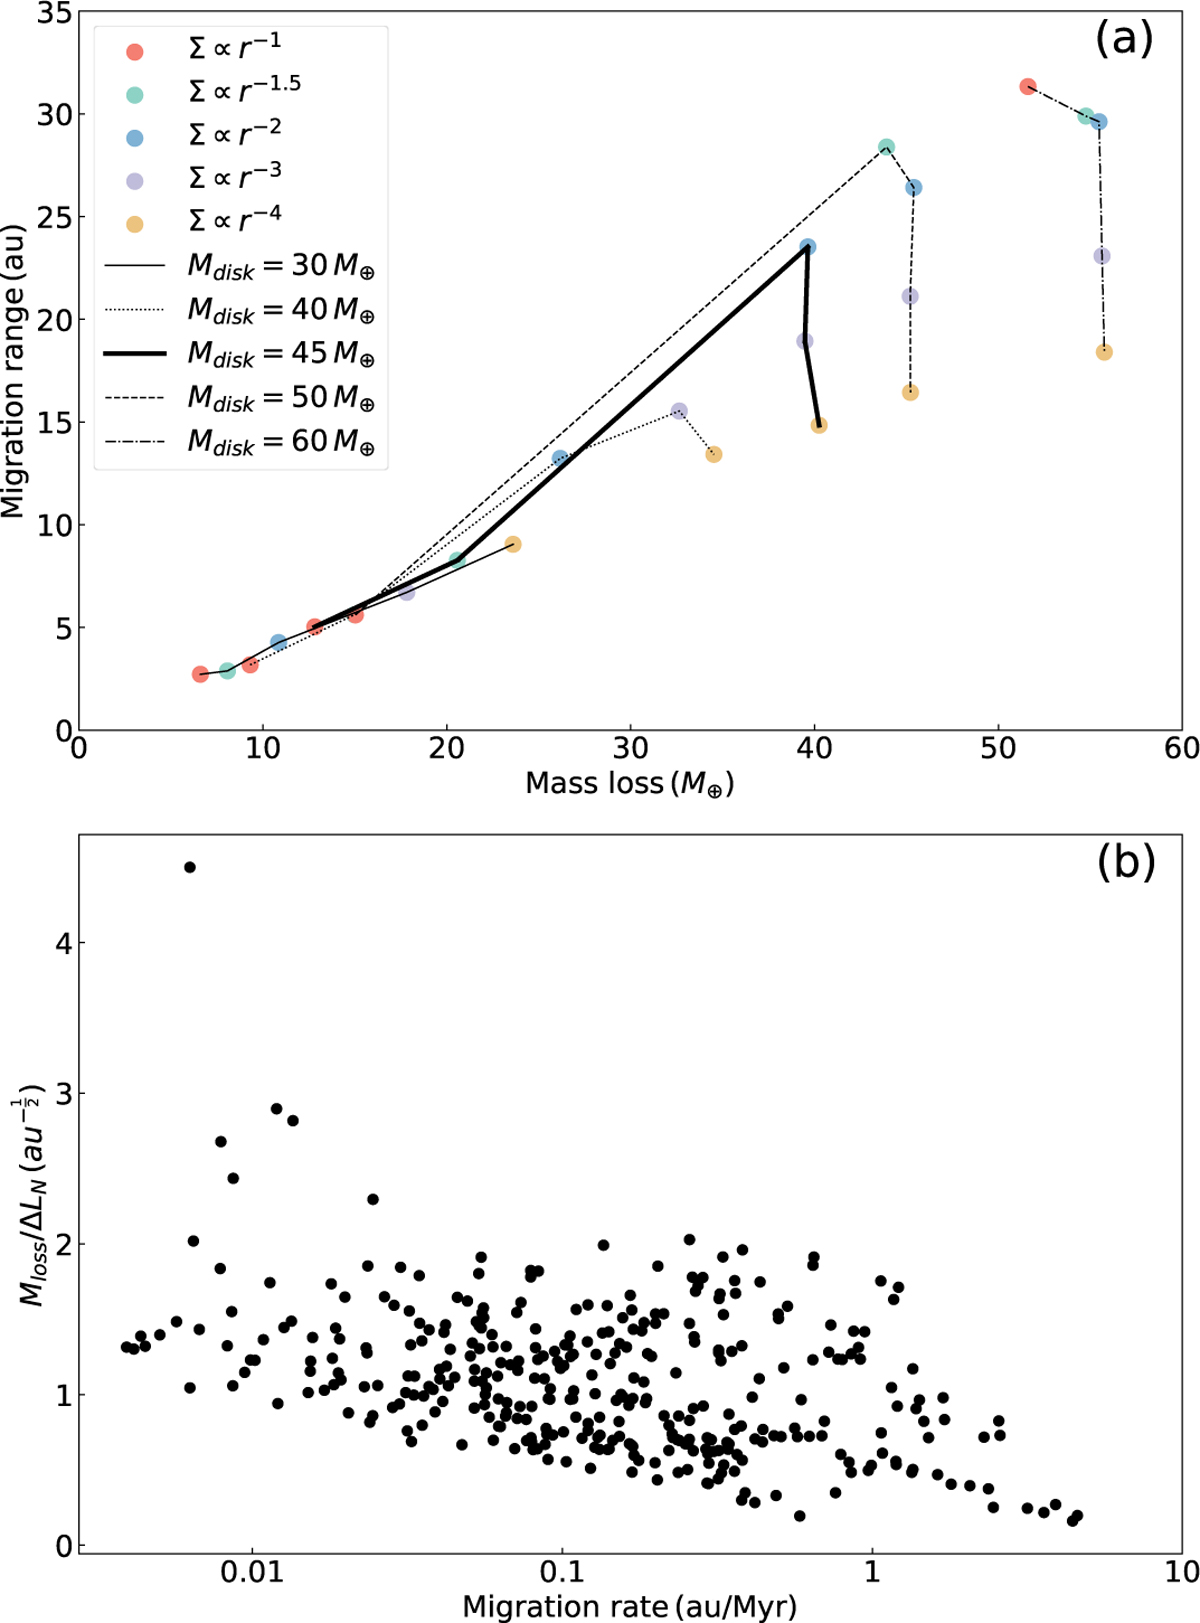
Neptune’s migration versus the mass loss of the planetesimal disk. The upper panel illustrates the connection between the total mass loss of the planetesimal disk (horizontal axis) and the total migration distance of Neptune (vertical axis). Different colors represent differen α, while different line styles indicate different Mdisk. In the lower panel, we calculated the time interval takes for Neptune to migrate per 1 au (from 18 au). The horizontal axis displays the average migration rate during each interval (logarithmic scale), and the vertical axis represents the ratio of consumed planetesimal mass to the angular momentum gained by Neptune within this interval.
Current usage metrics show cumulative count of Article Views (full-text article views including HTML views, PDF and ePub downloads, according to the available data) and Abstracts Views on Vision4Press platform.
Data correspond to usage on the plateform after 2015. The current usage metrics is available 48-96 hours after online publication and is updated daily on week days.
Initial download of the metrics may take a while.