Fig. 4
Download original image
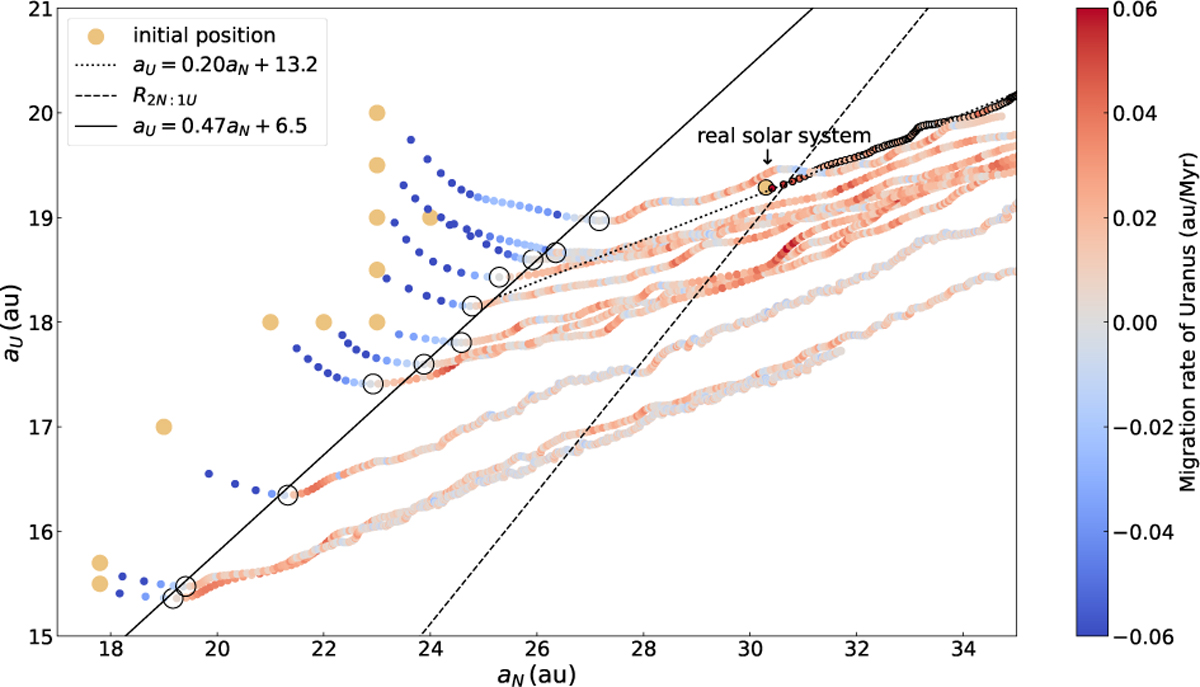
Evolution of the positions of Uranus and Neptune. The horizontal |and vertical axes represent the aN and aU, respectively. The color of the points indicates the migration rate of Uranus at each position. The orange dots denote the initial aN and aU in each set of simulations. The points with black borders represent hypothetical extensions of the real Solar System’s migration, while the dotted black line shows the linear fit of these points with black borders. The hollow circles mark the positions where aU reaches its minimum value, and the solid black line represents the linear fit of all black circles. The dashed black line indicates the location corresponding to the R2N:1U.
Current usage metrics show cumulative count of Article Views (full-text article views including HTML views, PDF and ePub downloads, according to the available data) and Abstracts Views on Vision4Press platform.
Data correspond to usage on the plateform after 2015. The current usage metrics is available 48-96 hours after online publication and is updated daily on week days.
Initial download of the metrics may take a while.