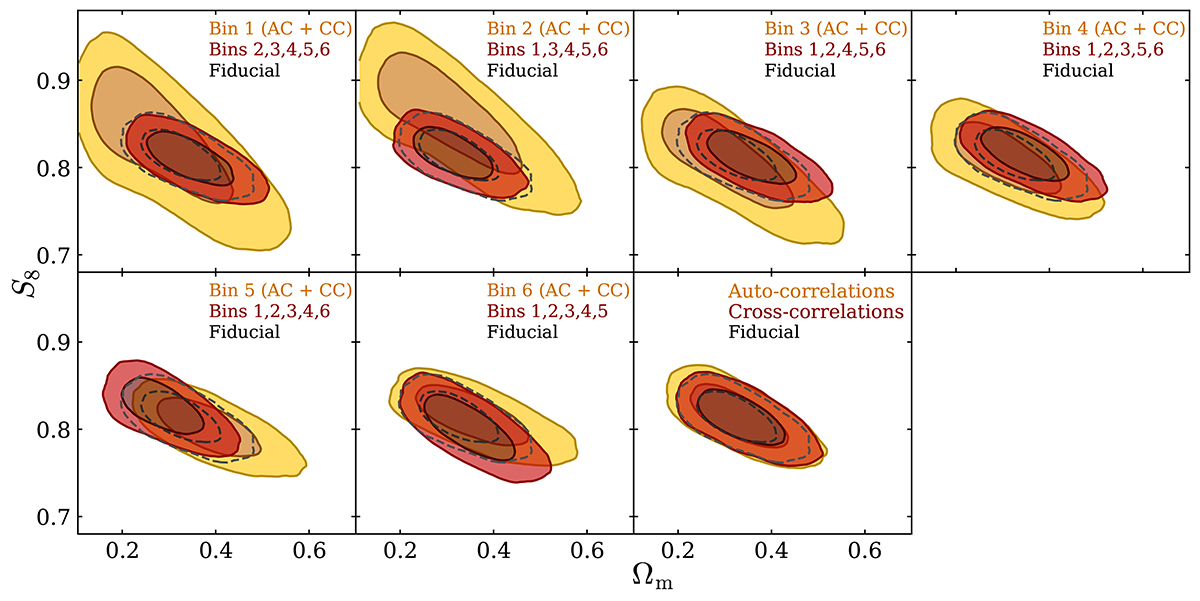
Fig. 1.
Download original image
Posterior distribution of the two instances of cosmological parameters in a split by redshift bin for COSEBIs. The yellow contours show the posterior of parameters modelling one specific redshift bin and its cross-correlation with the other bins, while the red contours show the posterior distribution of the parameters modelling the auto- and cross-correlation signal of the remaining redshift bins. The dashed contours show the fiducial constraints for reference. The final panel presents the posterior distribution in a split between auto-correlations of all redshift bins and their cross-correlations. When running the chains, both regimes are linked through the cross-covariance between redshift bins. The inner and outer contours of the marginalised posteriors correspond to the 68% and 95% credible intervals, respectively.
Current usage metrics show cumulative count of Article Views (full-text article views including HTML views, PDF and ePub downloads, according to the available data) and Abstracts Views on Vision4Press platform.
Data correspond to usage on the plateform after 2015. The current usage metrics is available 48-96 hours after online publication and is updated daily on week days.
Initial download of the metrics may take a while.