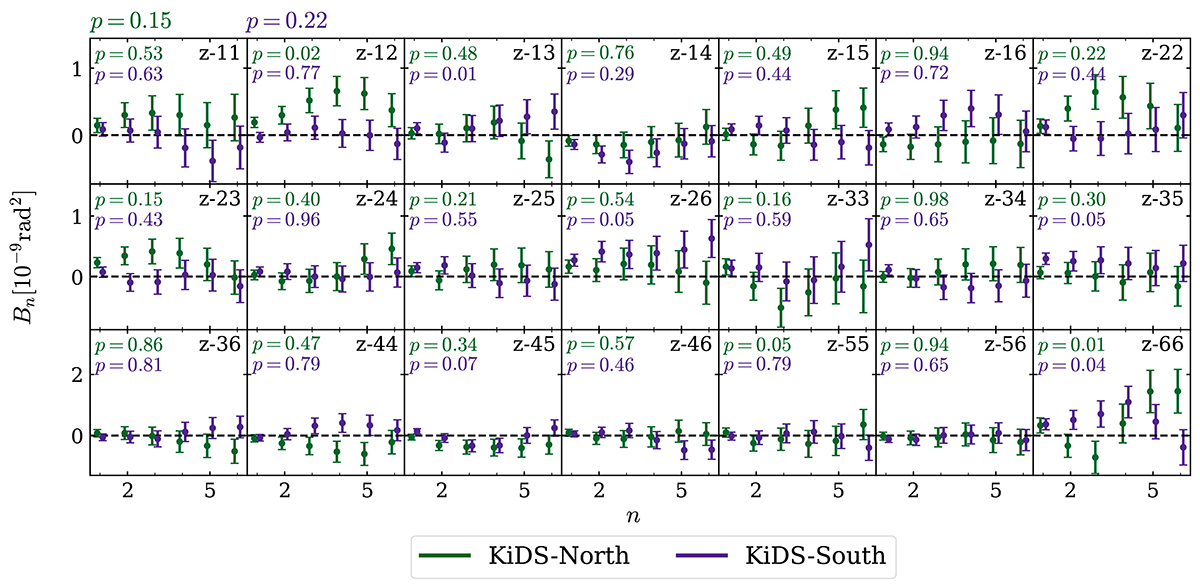
Fig. A.2.
Download original image
COSEBIs B-mode measurements for the North-South split catalogue. The green and purple data points show the measurements of the KiDS-North and KiDS-South sample, respectively. Each panel represents auto- or cross-correlation between tomographic bins, as indicated by the label in the top right corner. The corresponding p-value is denoted in the top left corner of each panel. The p-value of the combined data vector is given in the top left corner of the figure. For visualisation purposes, we display the discrete n modes with an offset on the x-axis. We note that the B-mode signals are highly correlated within a tomographic bin and advise against a so-called ‘χ-by-eye’.
Current usage metrics show cumulative count of Article Views (full-text article views including HTML views, PDF and ePub downloads, according to the available data) and Abstracts Views on Vision4Press platform.
Data correspond to usage on the plateform after 2015. The current usage metrics is available 48-96 hours after online publication and is updated daily on week days.
Initial download of the metrics may take a while.