Fig. 4.
Download original image
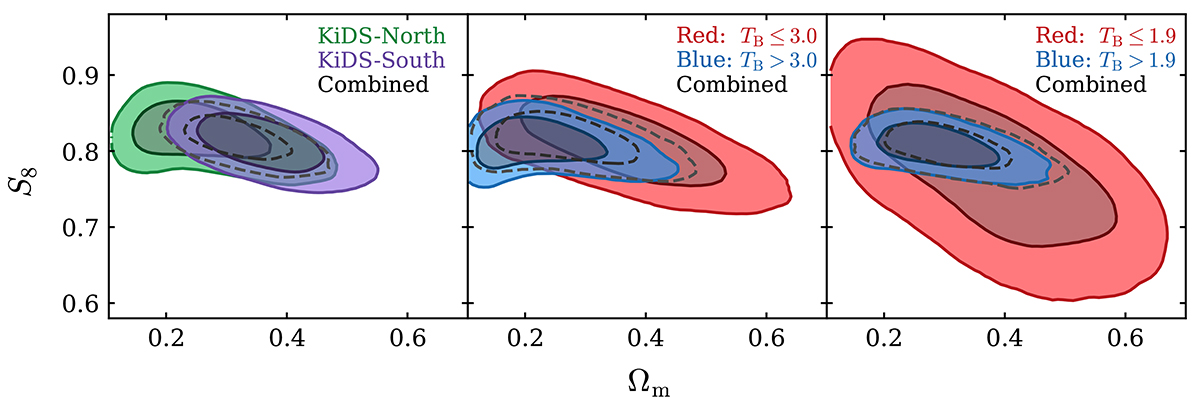
Posterior distribution of parameter duplicates in the Ωm − S8 plane for catalogue-level splits for COSEBIs. Left panel: north-South split. Middle panel: red-blue split defined via a cut on the spectral type of TB = 3.0. Right panel: red-blue split defined via a cut on the spectral type of TB = 1.9. For reference, the black dashed contours show constraints from the analysis with a single set of parameters modelling both data subsets. The inner and outer contours of the marginalised posteriors correspond to the 68% and 95% credible intervals, respectively.
Current usage metrics show cumulative count of Article Views (full-text article views including HTML views, PDF and ePub downloads, according to the available data) and Abstracts Views on Vision4Press platform.
Data correspond to usage on the plateform after 2015. The current usage metrics is available 48-96 hours after online publication and is updated daily on week days.
Initial download of the metrics may take a while.