Fig. 5.
Download original image
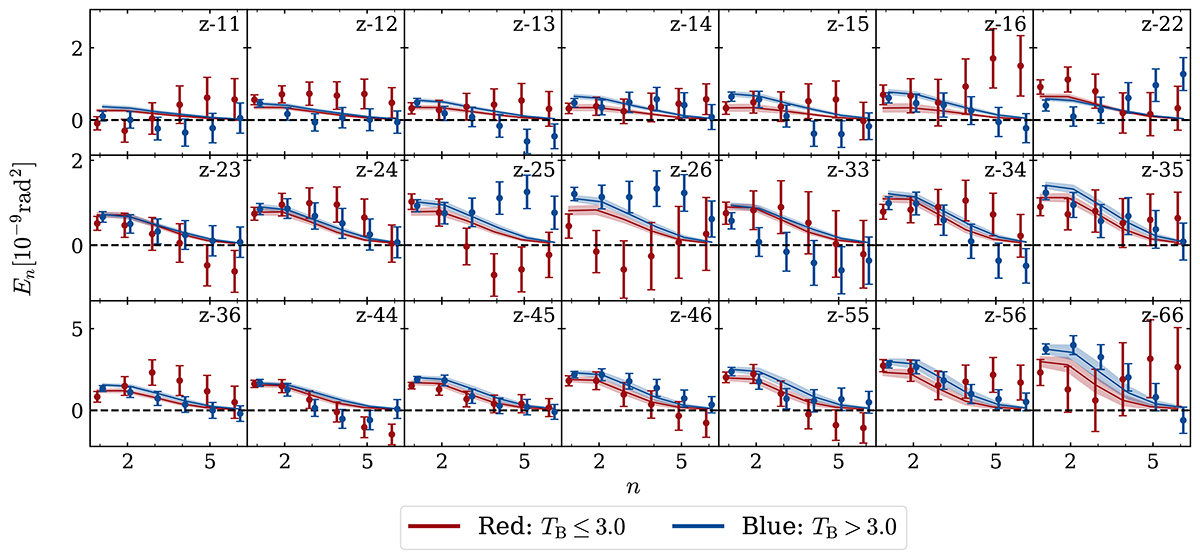
COSEBIs E-mode measurements and their best-fitting model for a split cosmological analysis of the red-blue split catalogue, defined via a cut on the spectral type TB = 3.0. The red and blue data points show the measurements of the red and blue sample, respectively. The best-fitting theoretical predictions are given by the solid lines, and the 1σ interval of the TPDs are illustrated by the shaded regions. Each panel represents auto- or cross-correlation between tomographic bins, as indicated by the label in the top right corner. For visualisation purposes, we display the discrete n modes with an offset on the x-axis. We note that the E-mode signals are highly correlated within a tomographic bin and advise against a so-called ‘χ-by-eye’.
Current usage metrics show cumulative count of Article Views (full-text article views including HTML views, PDF and ePub downloads, according to the available data) and Abstracts Views on Vision4Press platform.
Data correspond to usage on the plateform after 2015. The current usage metrics is available 48-96 hours after online publication and is updated daily on week days.
Initial download of the metrics may take a while.