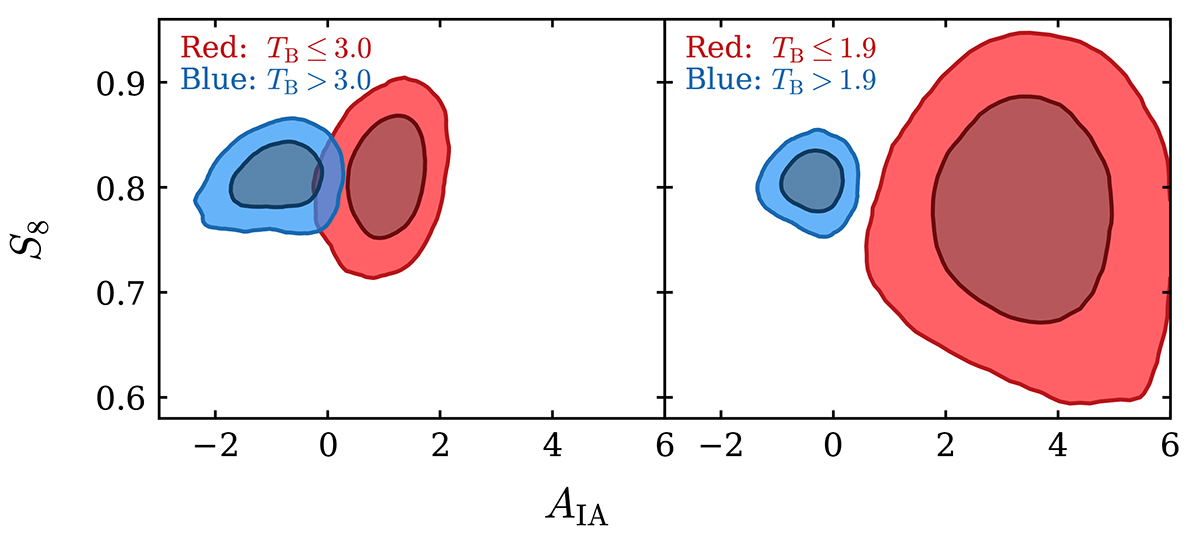
Fig. 6.
Download original image
Constraints on S8 and AIA for colour-based splits of the catalogue. Left panel: Red-blue split defined via a cut on the spectral type of TB = 3.0. Right panel: Red-blue split defined via a cut on the spectral type of TB = 1.9. For this threshold, the catalogue only contains very few red galaxies with zB > 1.14. Therefore, the red galaxy sample only encompasses the first five tomographic bins. The inner and outer contours of the marginalised posteriors correspond to the 68% and 95% credible intervals, respectively.
Current usage metrics show cumulative count of Article Views (full-text article views including HTML views, PDF and ePub downloads, according to the available data) and Abstracts Views on Vision4Press platform.
Data correspond to usage on the plateform after 2015. The current usage metrics is available 48-96 hours after online publication and is updated daily on week days.
Initial download of the metrics may take a while.