Open Access
Fig. 1.
Download original image
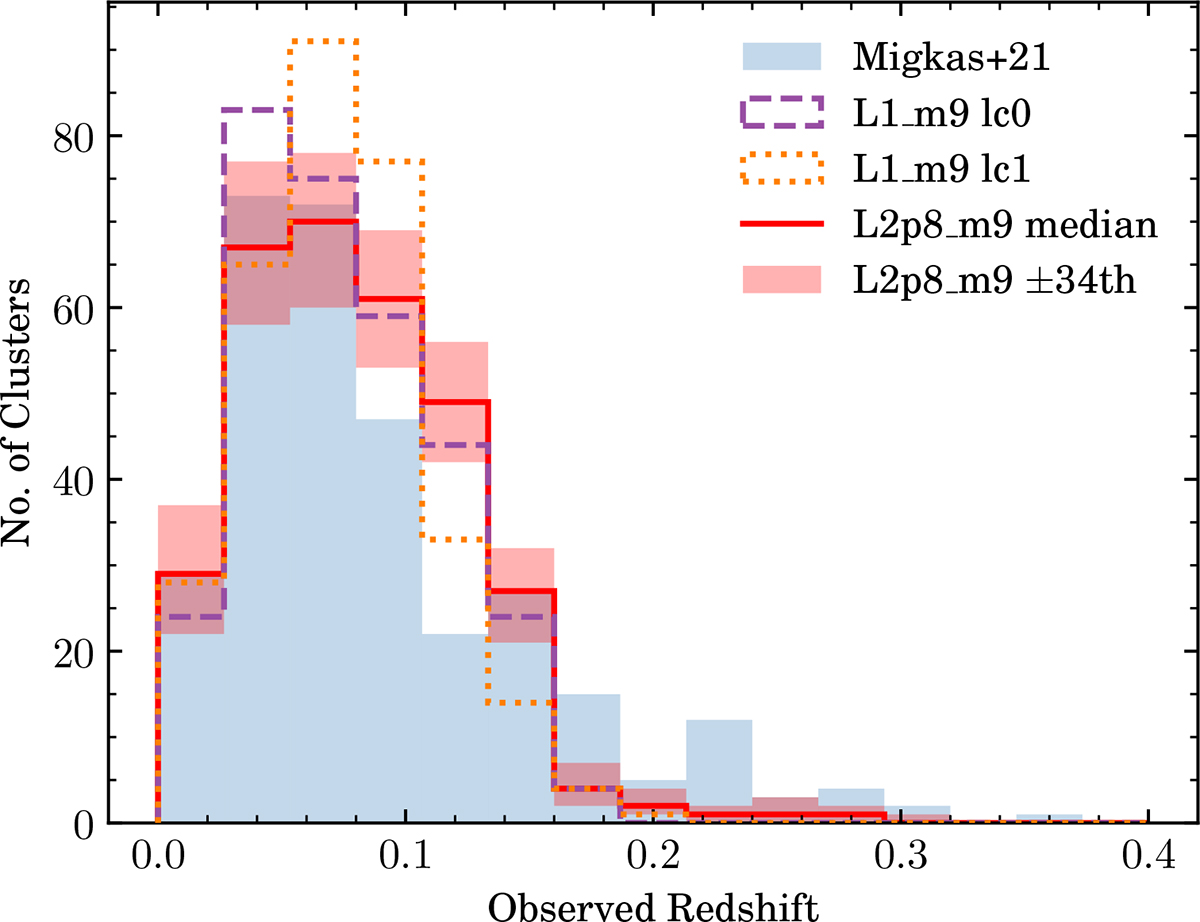
Average cluster redshift distribution of the 1728 (2.8 Gpc)3 lightcones (red) compared with two runtime (1.0 Gpc)3 lightcones (purple, orange) and the M21 sample (blue). The most X-ray concentrated clusters from the simulation were selected to match the M21 sample size (N = 313).
Current usage metrics show cumulative count of Article Views (full-text article views including HTML views, PDF and ePub downloads, according to the available data) and Abstracts Views on Vision4Press platform.
Data correspond to usage on the plateform after 2015. The current usage metrics is available 48-96 hours after online publication and is updated daily on week days.
Initial download of the metrics may take a while.