Fig. C.1.
Download original image
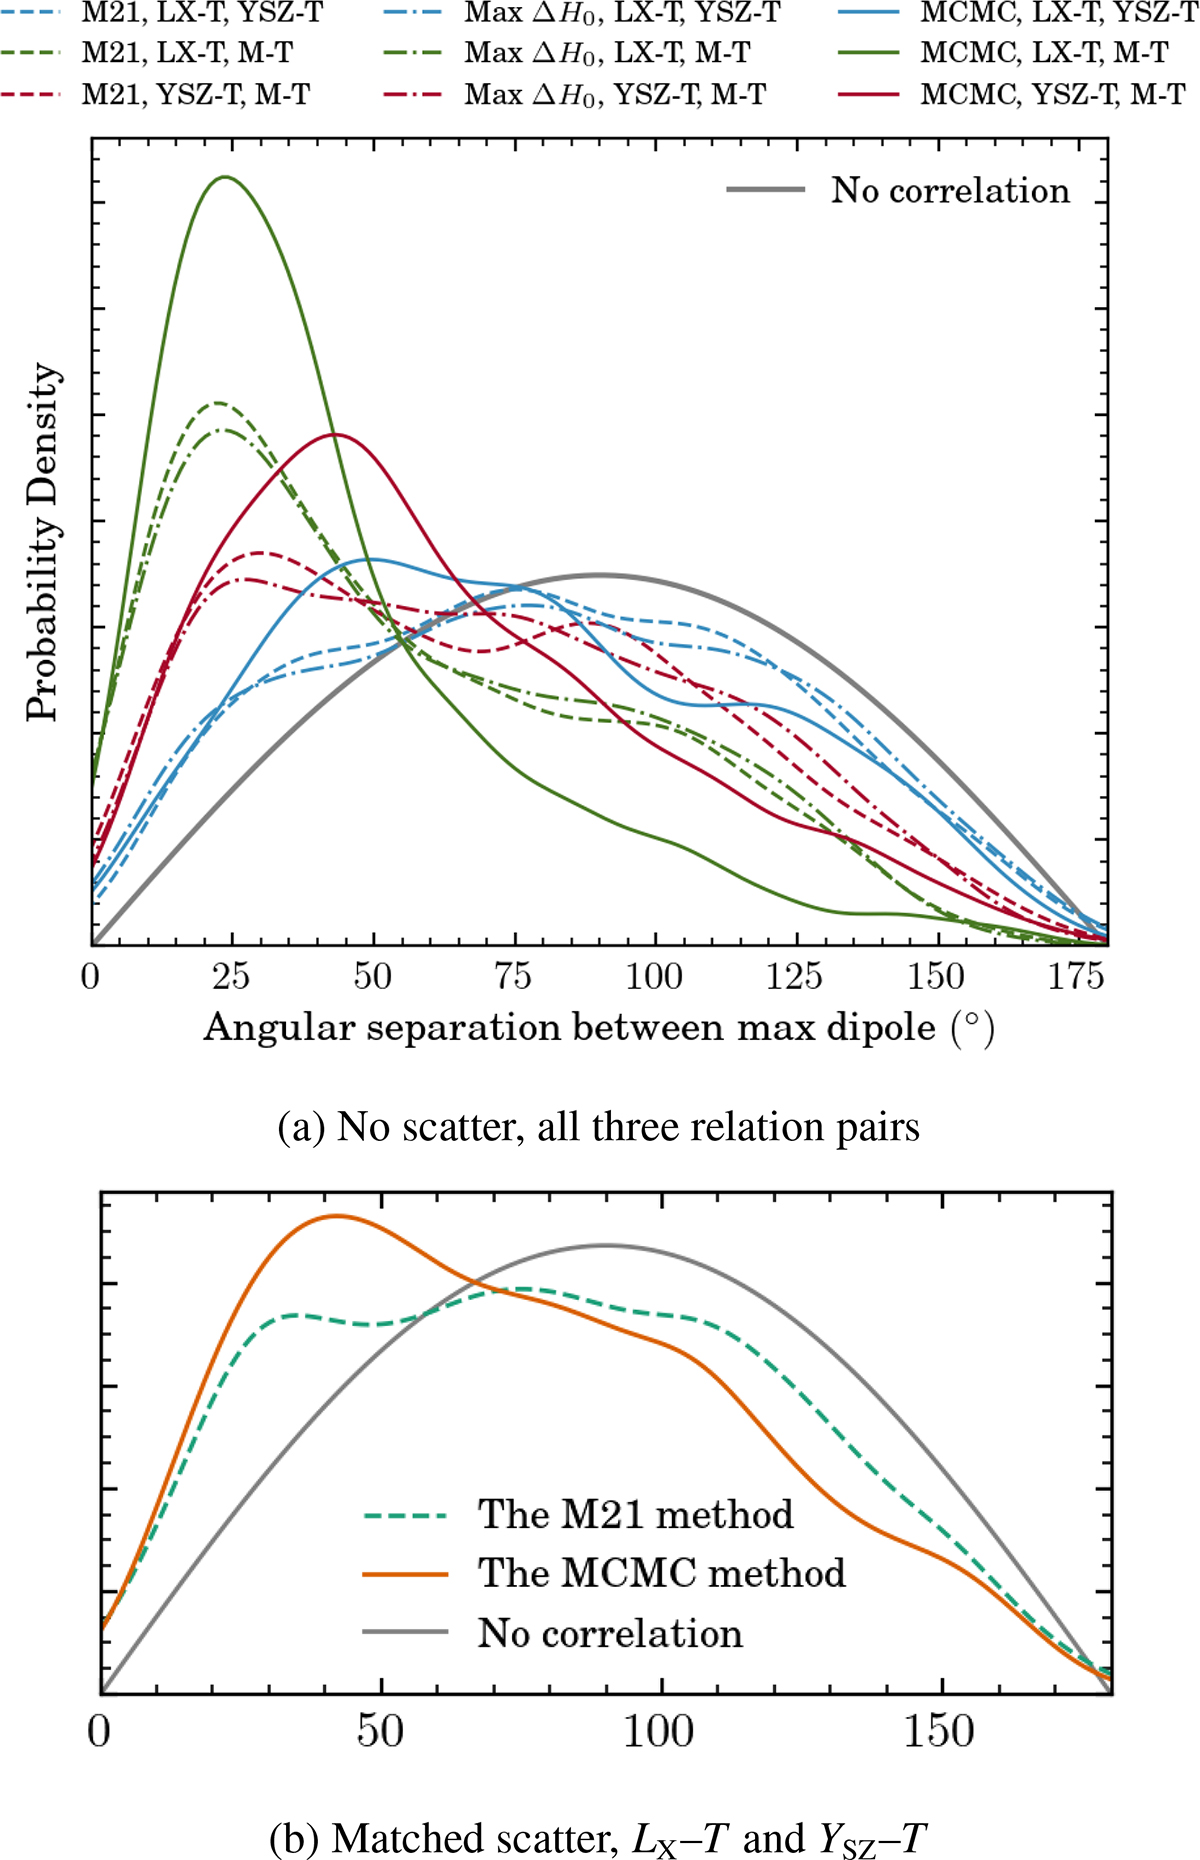
Angular separation between the best-fit dipoles derived from different relations, without (top) and with (bottom) injected scatter. Linestyles indicate statistical methods: solid for MCMC; dashed and dash-dotted for the M21 method, differing slightly in implementation. Dashed lines define the dipole by highest significance (our default for the M21 method); dash-dotted lines by highest amplitude. The two give nearly identical results. The grey line indicates the expected distribution for uncorrelated dipoles.
Current usage metrics show cumulative count of Article Views (full-text article views including HTML views, PDF and ePub downloads, according to the available data) and Abstracts Views on Vision4Press platform.
Data correspond to usage on the plateform after 2015. The current usage metrics is available 48-96 hours after online publication and is updated daily on week days.
Initial download of the metrics may take a while.