Open Access
Fig. E.1.
Download original image
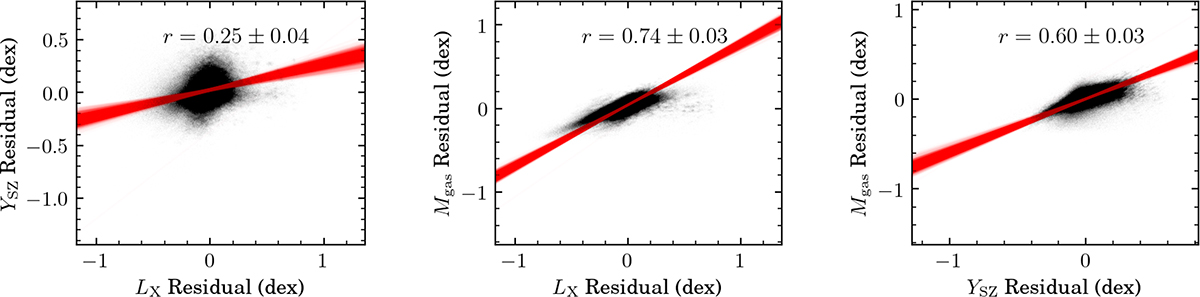
Correlation of scatter between LX − T and YSZ − T (left), LX − T and Mgas − T (middle) and YSZ − T and Mgas − T (right). Black dots are individual clusters. Red lines represent the linear fit of the lightcones. All of the 1728 lightcones are overlaid. r is Pearson’s correlation coefficient.
Current usage metrics show cumulative count of Article Views (full-text article views including HTML views, PDF and ePub downloads, according to the available data) and Abstracts Views on Vision4Press platform.
Data correspond to usage on the plateform after 2015. The current usage metrics is available 48-96 hours after online publication and is updated daily on week days.
Initial download of the metrics may take a while.