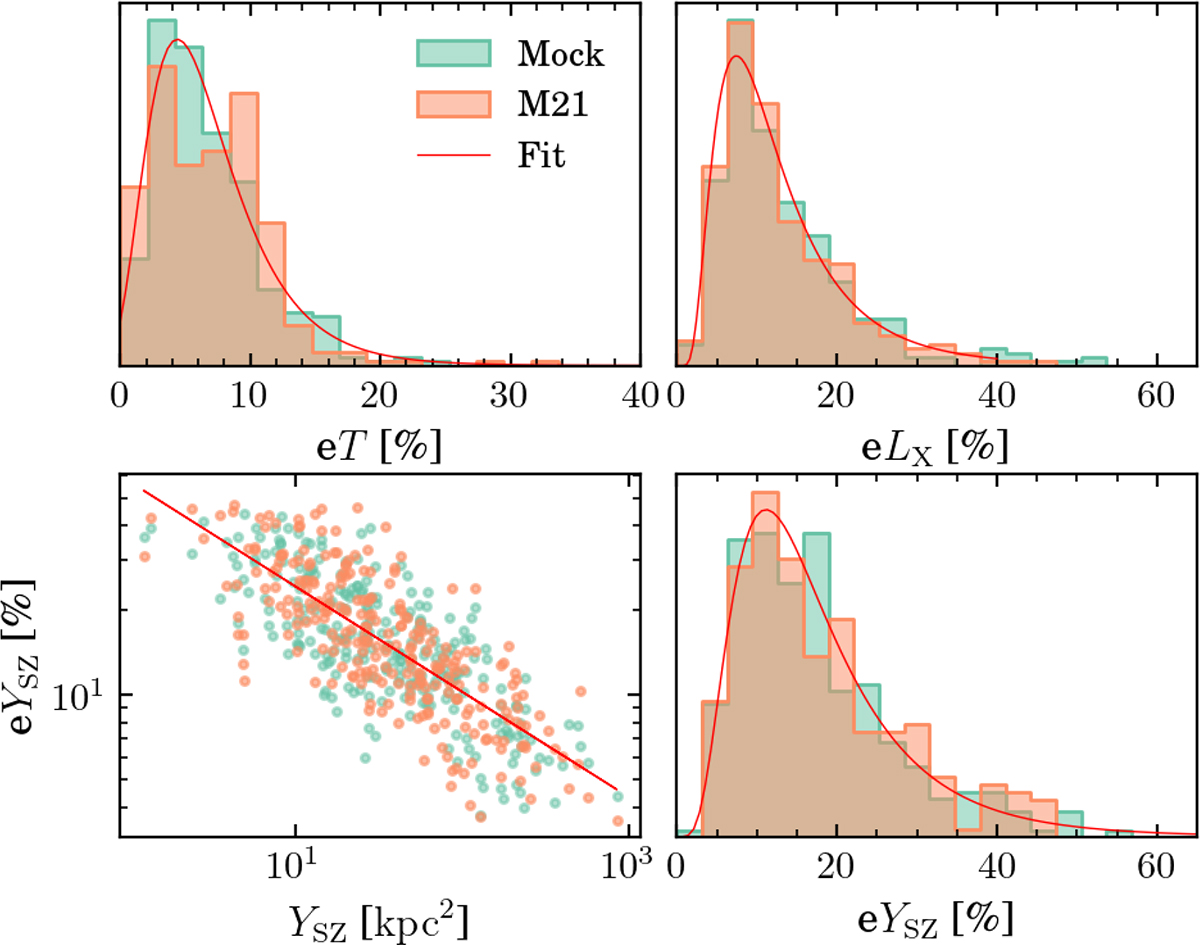
Fig. 2.
Download original image
Mock instrumental uncertainties for one lightcone in T (top left), LX (top right), and YSZ (bottom right) compared with the M21 sample. The bottom-left panel shows the correlation between YSZ and its uncertainty eYSZ. In each panel, the mock uncertainty (green) represents one realisation drawn from the fitted distribution (red).
Current usage metrics show cumulative count of Article Views (full-text article views including HTML views, PDF and ePub downloads, according to the available data) and Abstracts Views on Vision4Press platform.
Data correspond to usage on the plateform after 2015. The current usage metrics is available 48-96 hours after online publication and is updated daily on week days.
Initial download of the metrics may take a while.