Fig. 3.
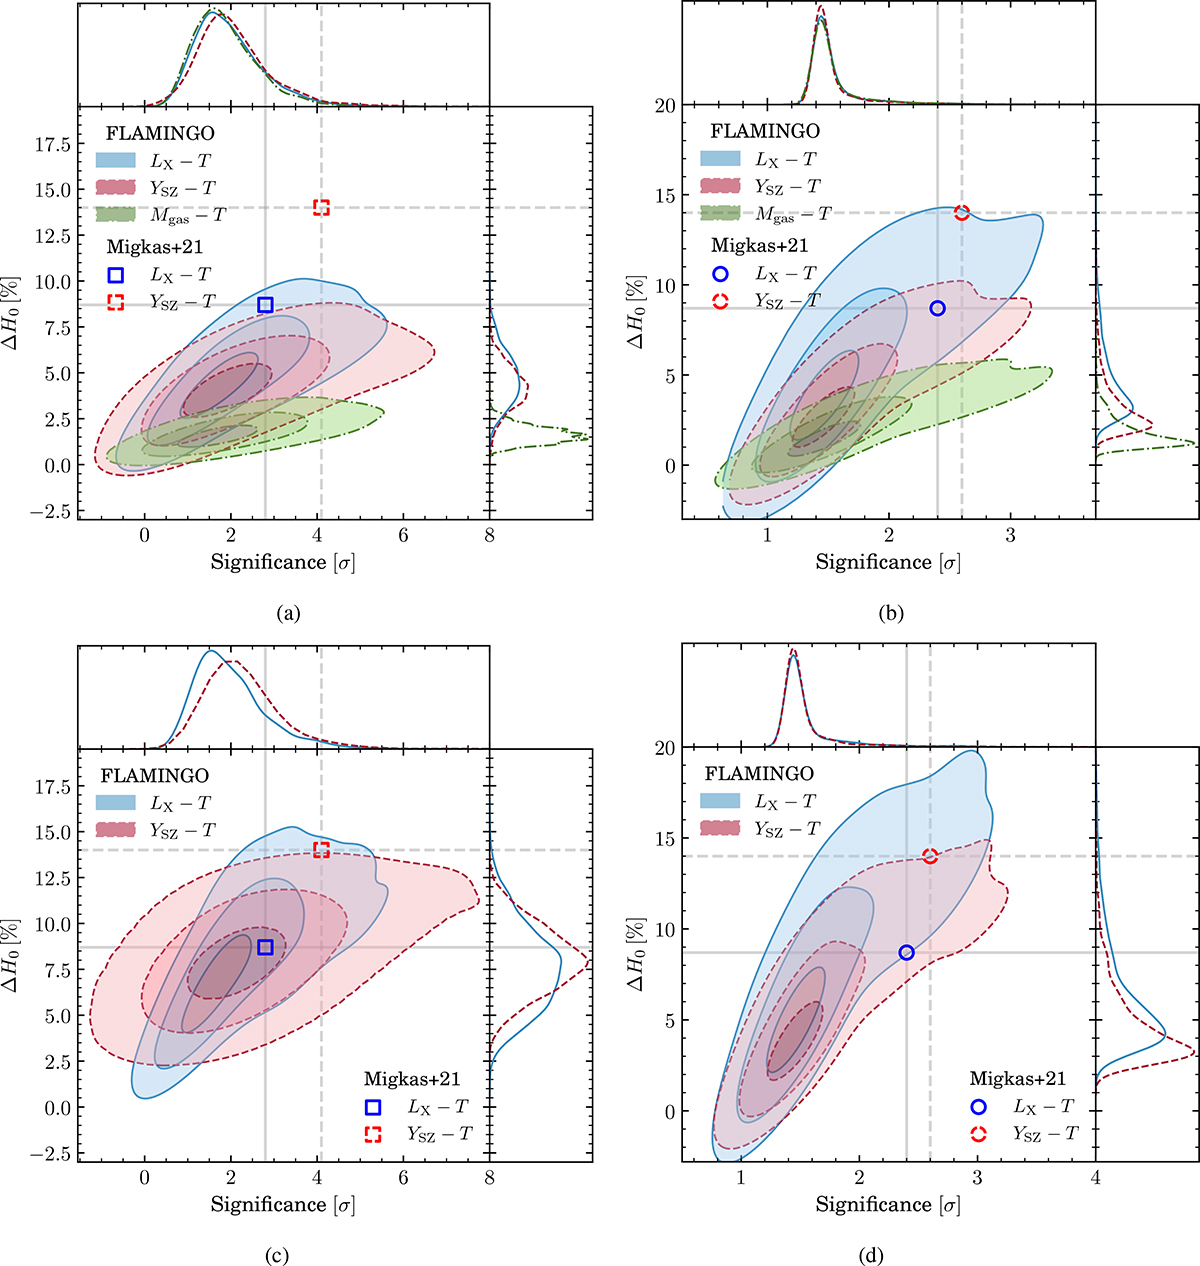
Download original image
Distribution of H0 variation and its statistical significance from 1728 lightcones using the M21 scanning method (left) and the MCMC method (right) with (bottom) and without (top) mock scatter. The blue solid, red dashed, and green dash-dotted contours correspond to constraints from the LX − T, YSZ − T, and Mgas − T relations, respectively. Contour levels indicate 39%, 86%, and 98.9% probability regions (equivalent to 1, 2, and 3σ in two dimensions). Blue (red) squares mark the M21 results from LX − T (YSZ − T), including their measured statistical significance. Blue (red) circles show the M21 results obtained from isotropic Monte Carlo realisations for LX − T (YSZ − T). While the LX − T results fall within the 3σ contours in every configuration, the YSZ − T results fall well outside the contours for the no-scatter case, and roughly at the 3σ limit for the matched scatter case.
Current usage metrics show cumulative count of Article Views (full-text article views including HTML views, PDF and ePub downloads, according to the available data) and Abstracts Views on Vision4Press platform.
Data correspond to usage on the plateform after 2015. The current usage metrics is available 48-96 hours after online publication and is updated daily on week days.
Initial download of the metrics may take a while.