Open Access
Fig. 4.
Download original image
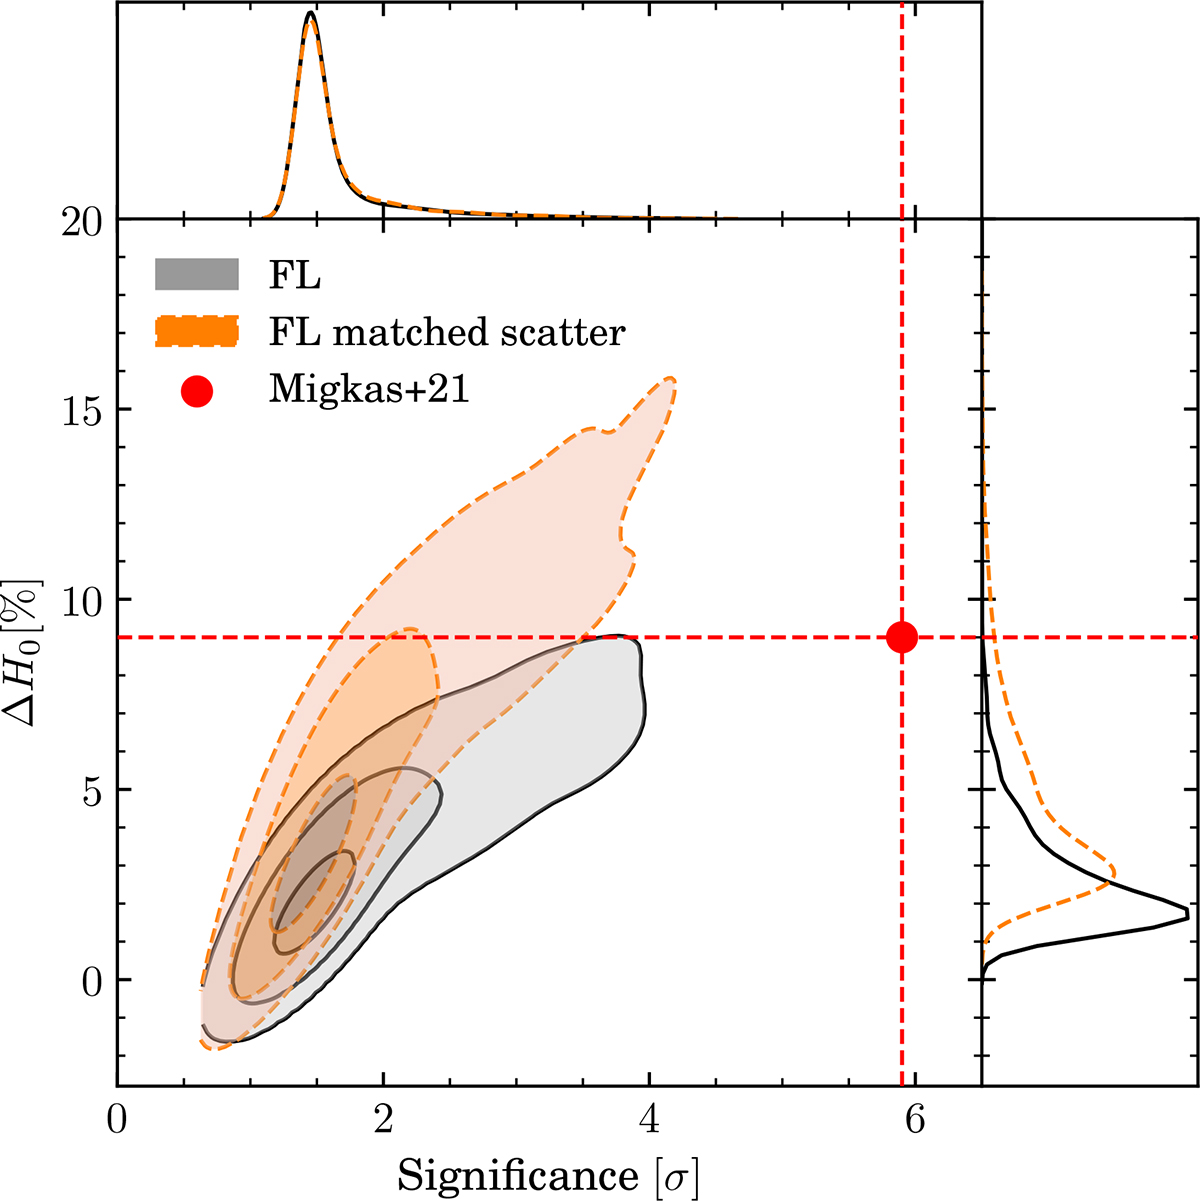
Joint MCMC constraint from the LX − T and YSZ − T relations compared to the combined M21 result (red dot). The orange contour includes injected scatter, while the grey does not. Contours show the 39%, 86%, and 98.9% confidence regions.
Current usage metrics show cumulative count of Article Views (full-text article views including HTML views, PDF and ePub downloads, according to the available data) and Abstracts Views on Vision4Press platform.
Data correspond to usage on the plateform after 2015. The current usage metrics is available 48-96 hours after online publication and is updated daily on week days.
Initial download of the metrics may take a while.