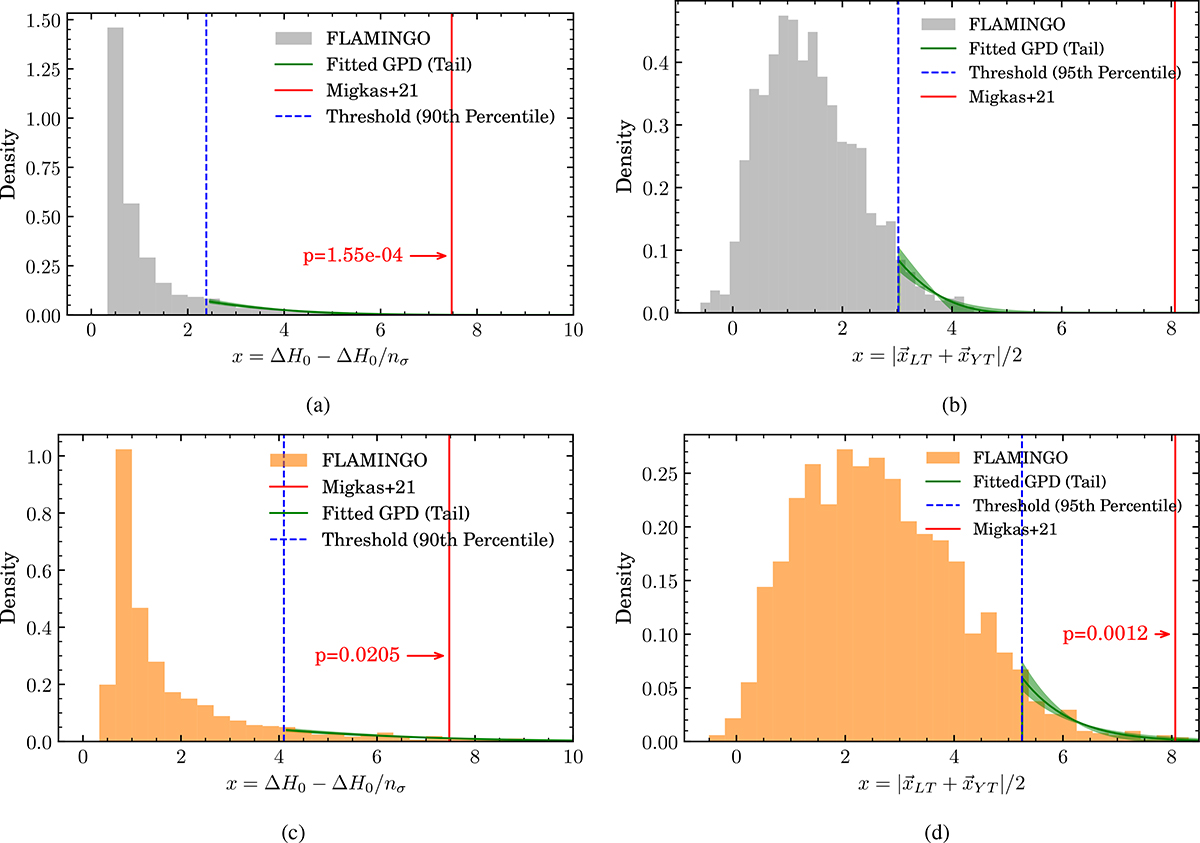
Fig. 5.
Download original image
Extreme value statistics analyses of joint H0 anisotropy in the FLAMINGO lightcones using the MCMC (left) and M21 (right) methods without (top) and with (bottom) matched scatter. Grey and orange histograms show the lower-bound projection of all 1728 lightcones without and with scatter, respectively. The red vertical line marks the M21 result under the same projection. The blue dashed line indicates the GPD threshold (90th or 95th percentile), above which the tail is modelled by a GDP, shown in green. The small shaded green region around the best fit line represents the 16th to 84th percentile region of bootstrapping error of the fit. Annotated in red is the EVS probability of obtaining the M21 result in FLAMINGO.
Current usage metrics show cumulative count of Article Views (full-text article views including HTML views, PDF and ePub downloads, according to the available data) and Abstracts Views on Vision4Press platform.
Data correspond to usage on the plateform after 2015. The current usage metrics is available 48-96 hours after online publication and is updated daily on week days.
Initial download of the metrics may take a while.