Fig. 6.
Download original image
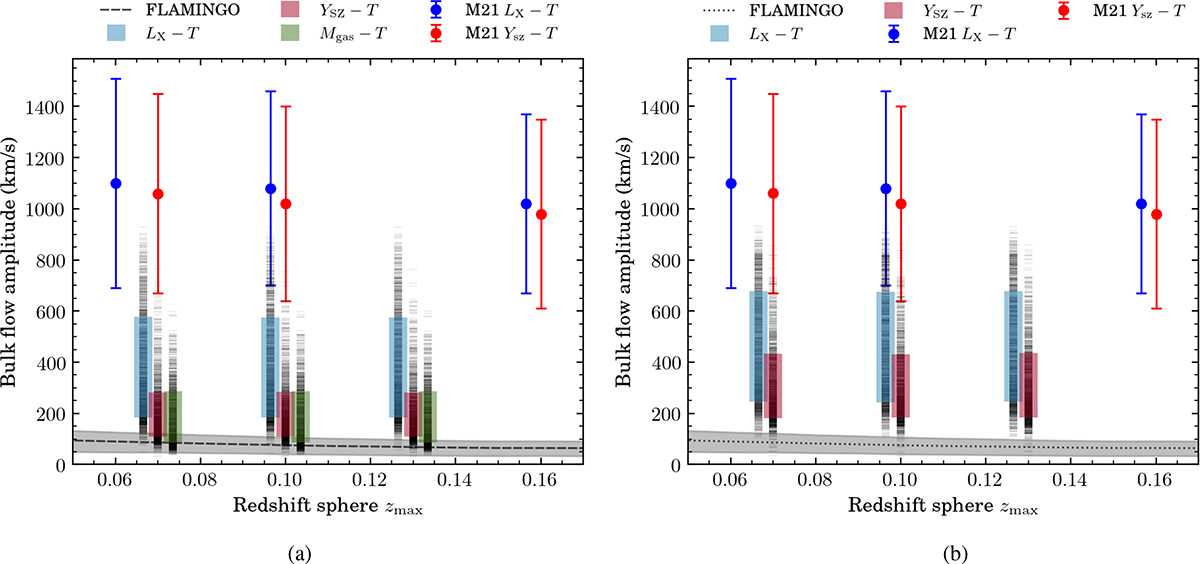
The MCMC bulk flow amplitude constraints for z < 0.07, z < 0.10, and z < 0.13 shown for the LX − T, YSZ − T, and Mgas − T relations. The right panel includes injected scatter and the left panel does not. Black dashes represent the results from individual lightcones, while the thick coloured bars indicate the 16th to 84th percentile range across the lightcones. For comparison, the M21 results for LX − T and YSZ − T are shown with their original error bars, corresponding to redshift spheres of z < 0.06, z < 0.07, z < 0.10, and z < 0.16. To avoid visual overlap, the points for LX − T and Mgas − T are slightly offset along the x-axis. The black dashed line represents the median true average bulk motion of the clusters, with the grey shaded region indicating the 16th to 84th percentile range of the lightcones. (a) No scatter. (b) Matched scatter.
Current usage metrics show cumulative count of Article Views (full-text article views including HTML views, PDF and ePub downloads, according to the available data) and Abstracts Views on Vision4Press platform.
Data correspond to usage on the plateform after 2015. The current usage metrics is available 48-96 hours after online publication and is updated daily on week days.
Initial download of the metrics may take a while.