Open Access
Fig. 7.
Download original image
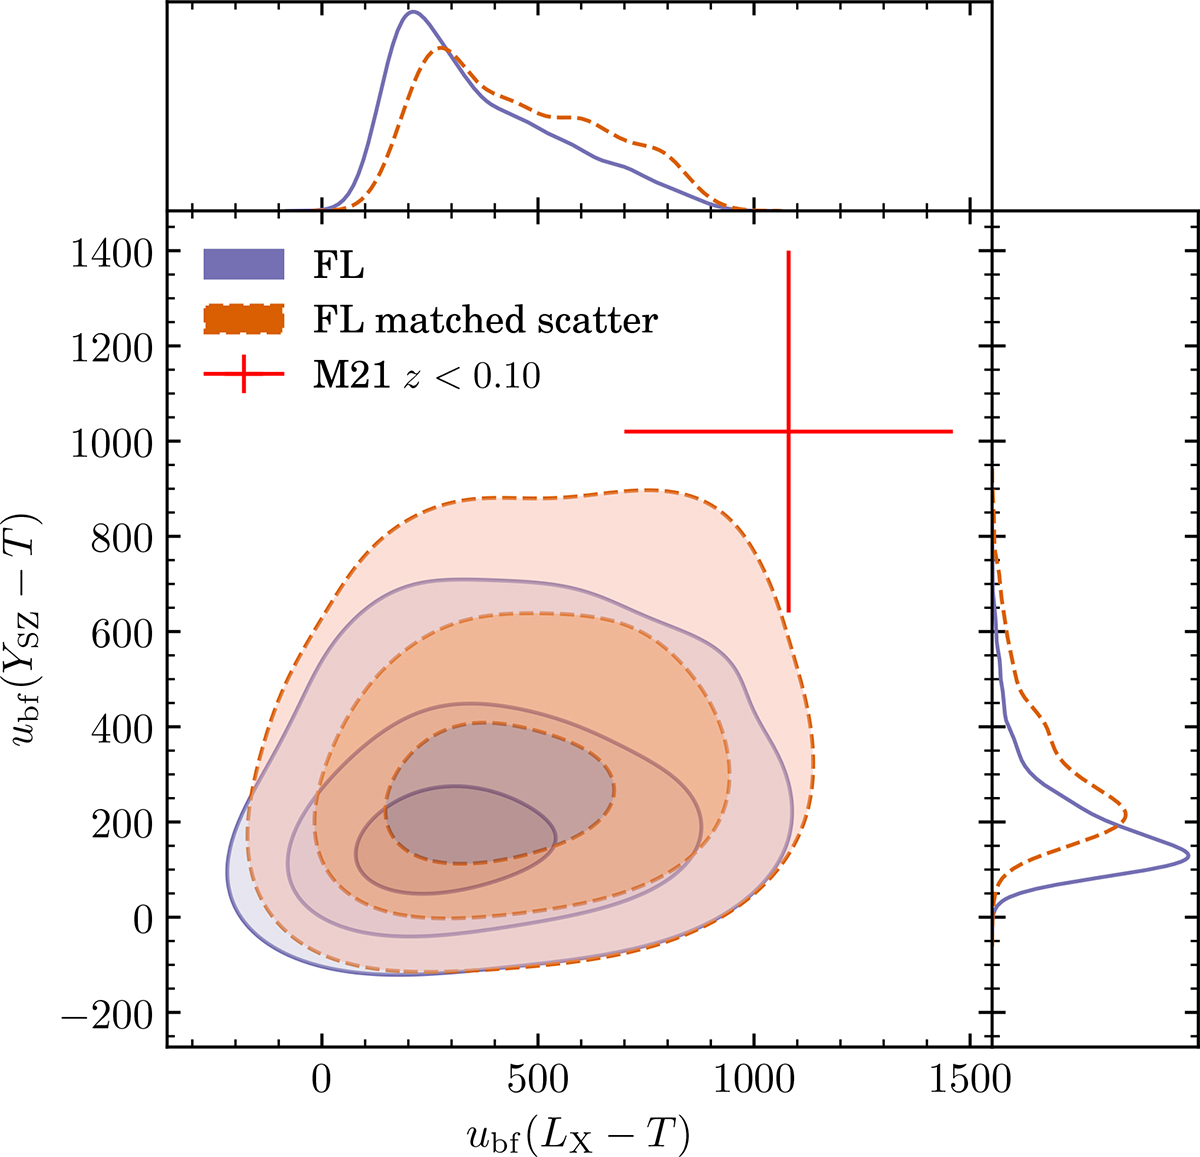
Distribution of the LX − T and YSZ − T bulk flow constraints at z < 0.10 along with the M21 result at the same redshift with its error bars (red). The orange contour includes injected scatter, while the purple does not. Contours of different shades give the 39%, 86%, and 98.9% regions.
Current usage metrics show cumulative count of Article Views (full-text article views including HTML views, PDF and ePub downloads, according to the available data) and Abstracts Views on Vision4Press platform.
Data correspond to usage on the plateform after 2015. The current usage metrics is available 48-96 hours after online publication and is updated daily on week days.
Initial download of the metrics may take a while.