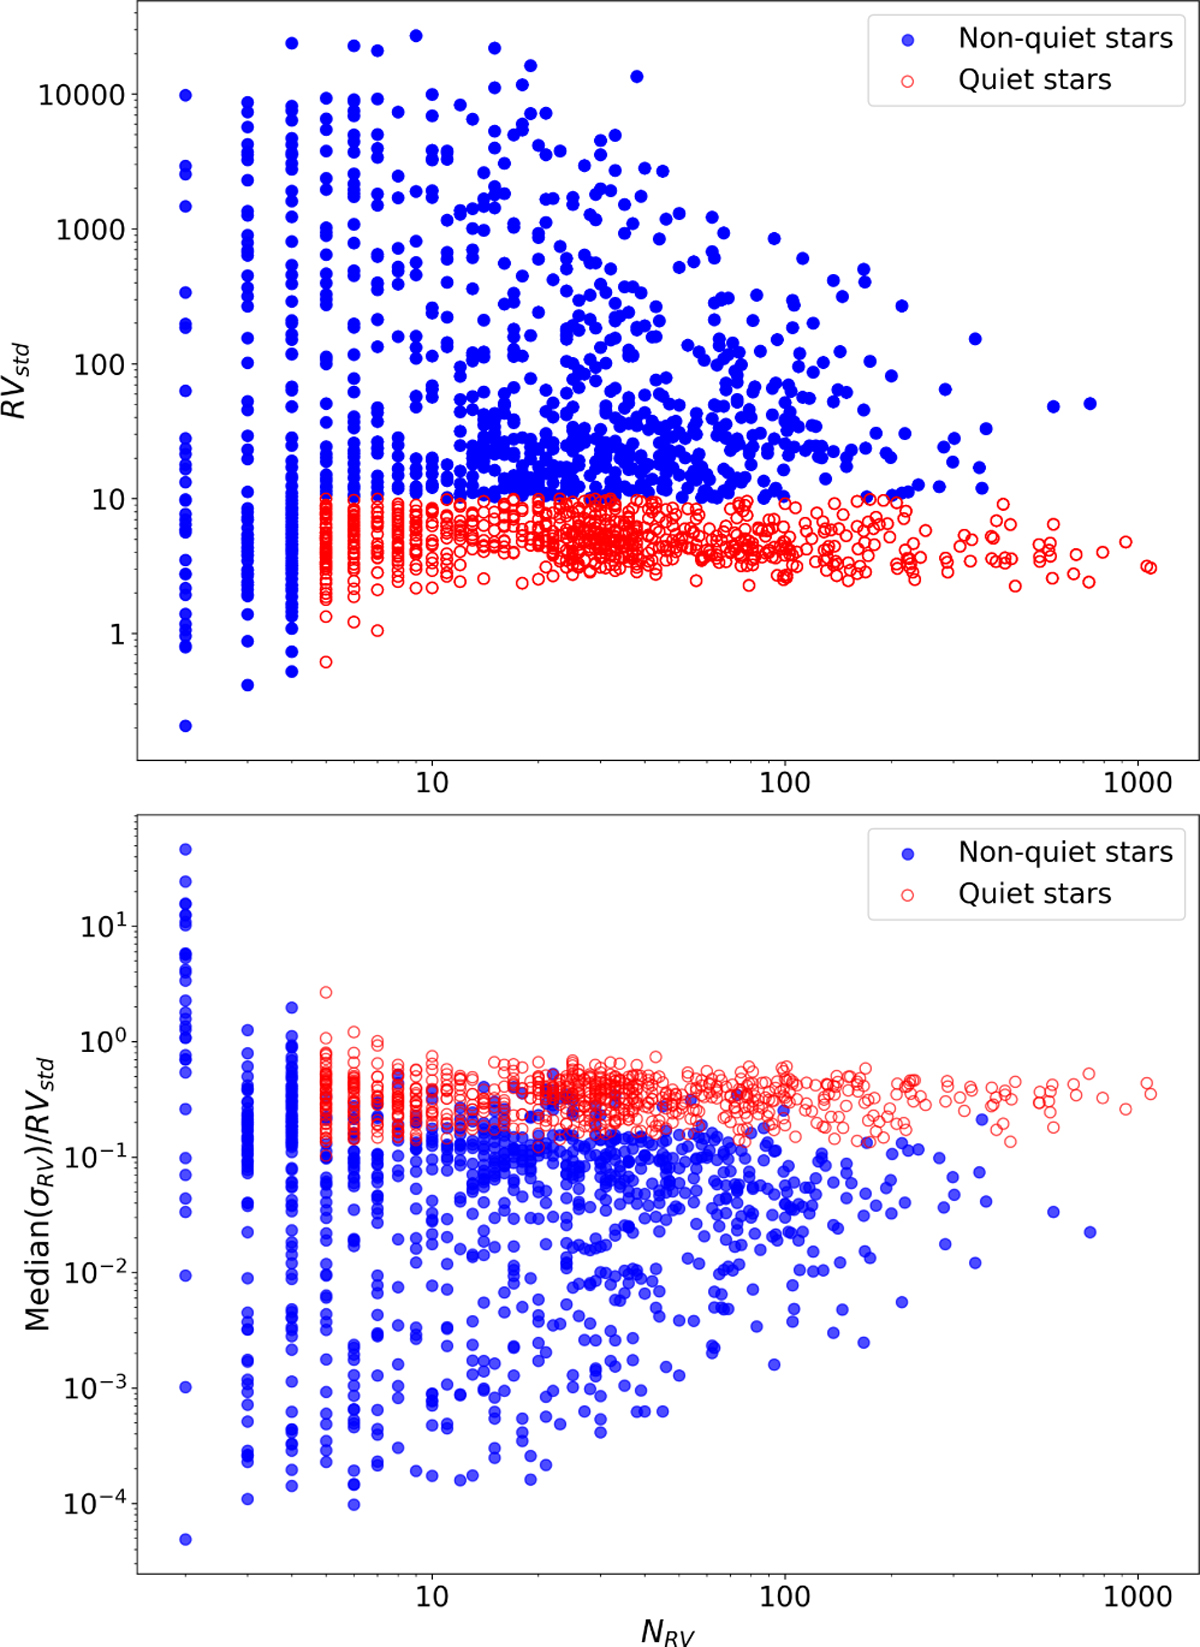
Fig. 3
Download original image
Representation of RV measurements color-coded by RV-quiet threshold criteria: quiet in red and non-quiet in blue. Top: standard deviation of the (NZP-corrected) RVs as a function of the number of RV observations (NRV). Bottom: ratio between the median RV uncertainty and the standard deviation of the corrected RVs, providing a measure of how well the RV precision accounts for the observed scatter.
Current usage metrics show cumulative count of Article Views (full-text article views including HTML views, PDF and ePub downloads, according to the available data) and Abstracts Views on Vision4Press platform.
Data correspond to usage on the plateform after 2015. The current usage metrics is available 48-96 hours after online publication and is updated daily on week days.
Initial download of the metrics may take a while.