Fig. 6
Download original image
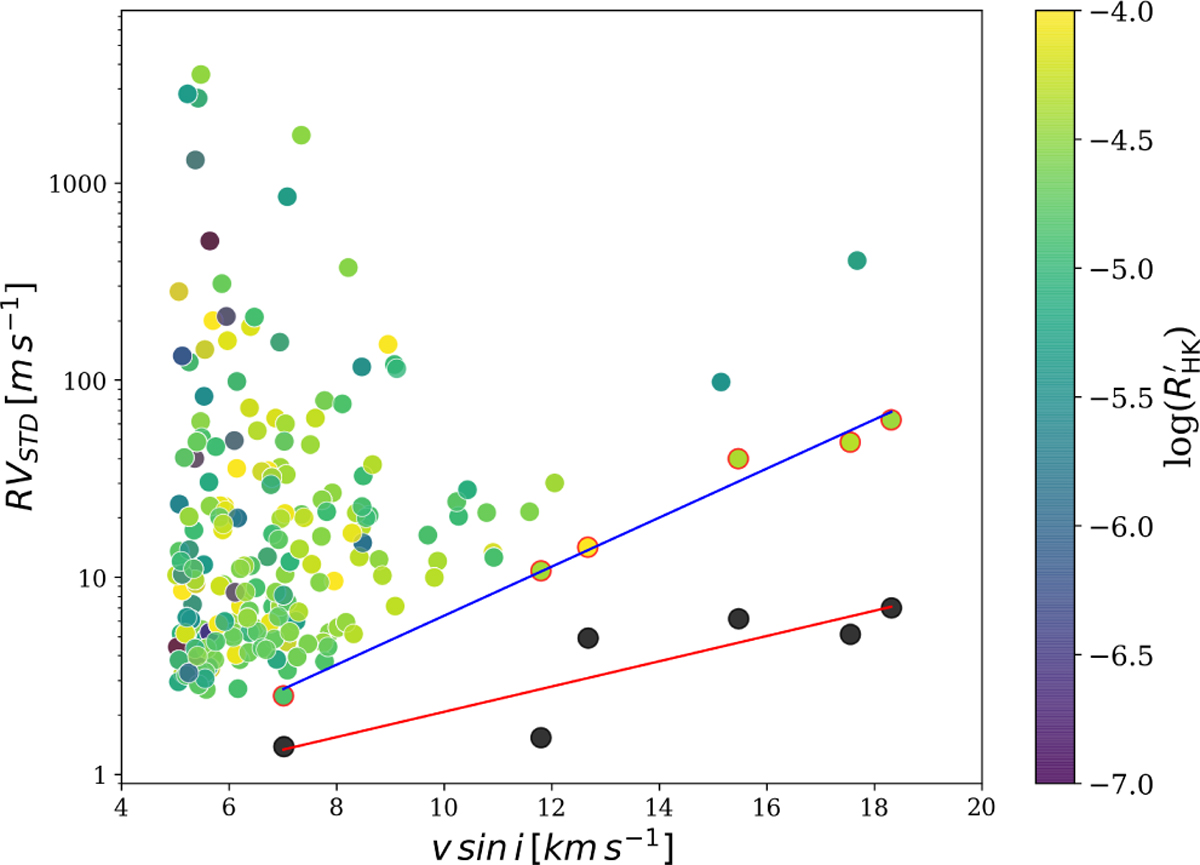
RVstd as a function of the projected rotational velocity. The blue and red lines are two linear regression fits: blue for the lower-envelope RVstd values of the six stars whose RVs are dominated by stellar activity rather than by orbital motion (from left to right: HD 202751, HD 214749, HD 210302, HD 21847, HD 377, and HD 25998), and red for the median RV uncertainties of the same stars. Data points are color-coded by log(R′HK) to indicate chromospheric activity levels. Since Gaia has known problems with correctly measuring the v sin i of cool dwarfs (Teff < 4300 K), we removed cool dwarfs from the plot and only make line fits in the v sin i > 7 km s−1 region.
Current usage metrics show cumulative count of Article Views (full-text article views including HTML views, PDF and ePub downloads, according to the available data) and Abstracts Views on Vision4Press platform.
Data correspond to usage on the plateform after 2015. The current usage metrics is available 48-96 hours after online publication and is updated daily on week days.
Initial download of the metrics may take a while.