Fig. 8
Download original image
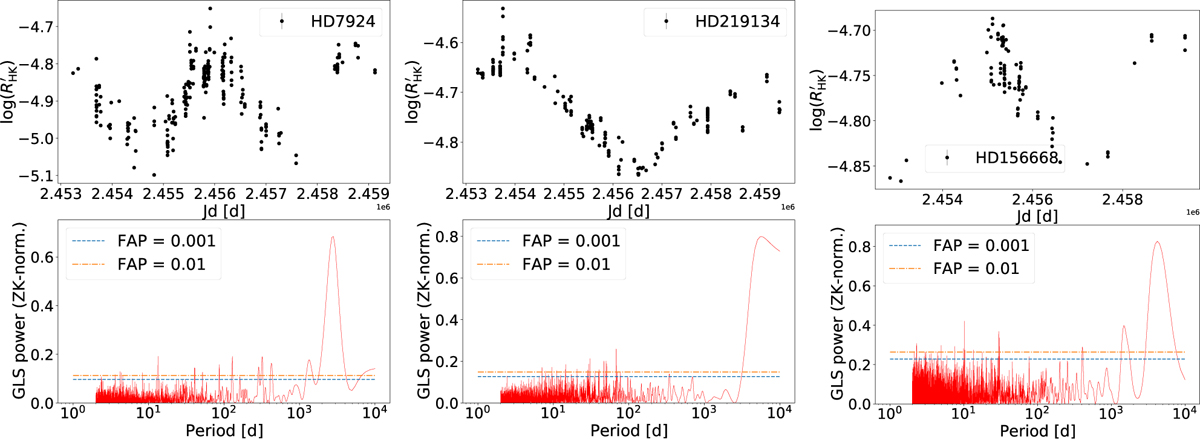
Example of the R′HK time series (black dots in the upper panel) and the corresponding GLS power spectrum (red line in the lower panel), for HD 7924, HD 219134, and HD 156668. Prominent periodicities in the R′HK data appear as peaks in the GLS plot. The 1% and 0.1% false-alarm probability levels are indicated in blue and orange, respectively.
Current usage metrics show cumulative count of Article Views (full-text article views including HTML views, PDF and ePub downloads, according to the available data) and Abstracts Views on Vision4Press platform.
Data correspond to usage on the plateform after 2015. The current usage metrics is available 48-96 hours after online publication and is updated daily on week days.
Initial download of the metrics may take a while.