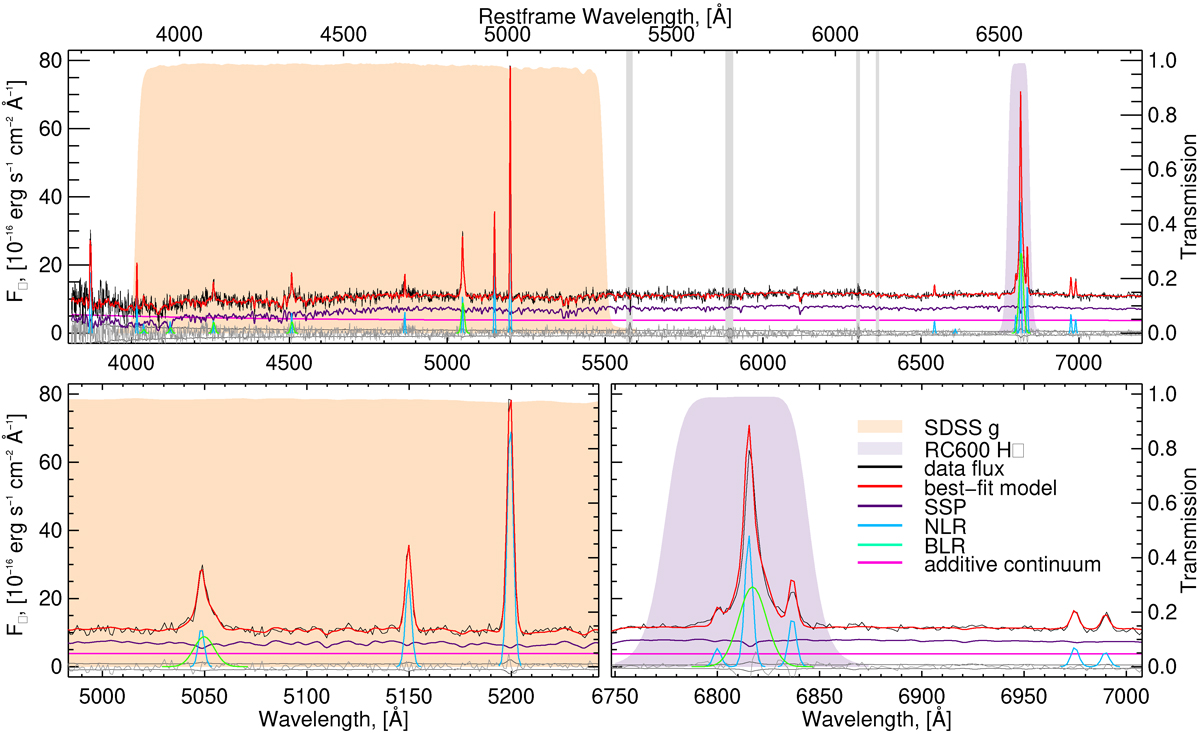
Fig. 3.
Download original image
NBURSTS fitting results for SDSS spectrum J1448+16 using X-Shooter SSP models and Gaussian BLR profiles. Upper ticks correspond to rest-frame wavelengths, while the middle and bottom ticks correspond to observed wavelengths. Top panel: Full wavelength range of the SDSS spectrum; Bottom panels: Zoom-in on the surrounding ranges of two emission lines Hβ and Hα. In all panels: the black line corresponds to spectrum fluxes; the red line to the best-fit model; the purple line to the stellar population model including multiplicative continuum (stellar component); the light pink line to the additive continuum component describing the AGN continuum; the light blue and green lines to emission lines templates for NLR and BLR, respectively; the dark gray line to the data-model residuals; the colored shaded regions to the filter transmission curves of SDSS g′ in light orange and narrow Hα in light purple; and, finally, the light gray shaded bands to masked and excluded regions from the fit.
Current usage metrics show cumulative count of Article Views (full-text article views including HTML views, PDF and ePub downloads, according to the available data) and Abstracts Views on Vision4Press platform.
Data correspond to usage on the plateform after 2015. The current usage metrics is available 48-96 hours after online publication and is updated daily on week days.
Initial download of the metrics may take a while.