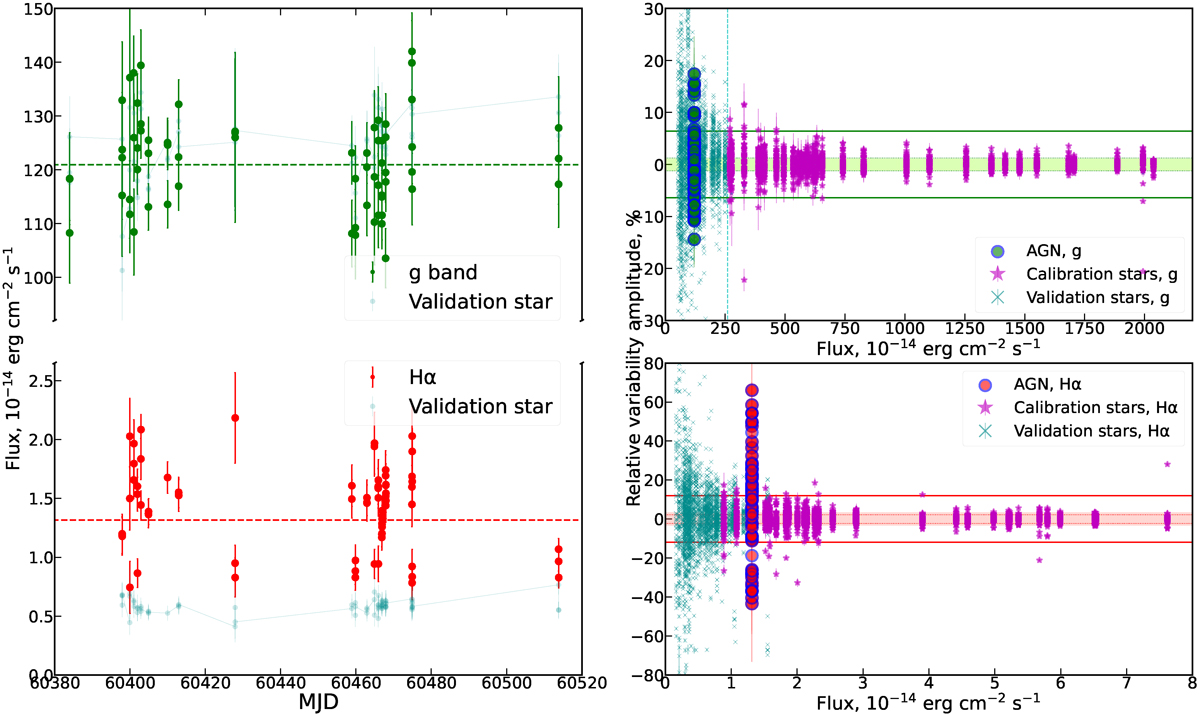
Fig. 4.
Download original image
Edge colors for markers in the right graphs correspond to the object classes: blue is AGN, magenta is calibration stars, and dark cyan is validation stars. Left: RC600 light-curve of J1448+16 binned by individual nights. The green points correspond to SDSS g′ flux, the red points correspond to Hα flux. The pale cyan line represents the weighted mean validation star. Right: Relative variability amplitude in g′ and Hα bands. The large circles show the variability of the AGN, the magenta stars demonstrate the variability of 33 calibrating stars (due to measurement uncertainties) and the crosses represent the validation sample of 54 faint stars. The vertical cyan line denotes the separating flux (in g′-band) between calibration and validation samples.
Current usage metrics show cumulative count of Article Views (full-text article views including HTML views, PDF and ePub downloads, according to the available data) and Abstracts Views on Vision4Press platform.
Data correspond to usage on the plateform after 2015. The current usage metrics is available 48-96 hours after online publication and is updated daily on week days.
Initial download of the metrics may take a while.