Open Access
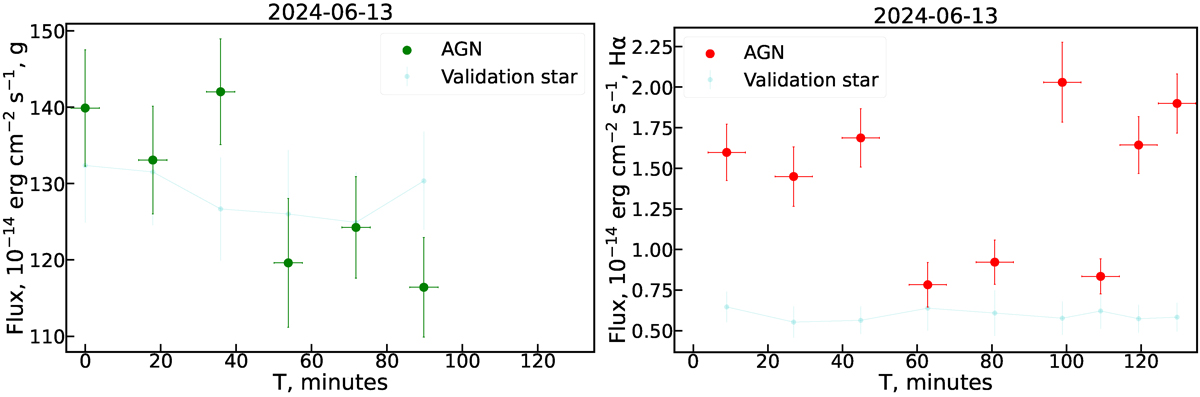
Fig. 5.
Download original image
Left: Corrected AGN luminosity in individual g-band frames during the night of 2024-06-13. Right: Same as left panel, but for Hα. The observations span a time range of ∼2 hours, the timestamps are relative to the start of the first g-band exposure. The X-axis error bars represent individual exposure times.
Current usage metrics show cumulative count of Article Views (full-text article views including HTML views, PDF and ePub downloads, according to the available data) and Abstracts Views on Vision4Press platform.
Data correspond to usage on the plateform after 2015. The current usage metrics is available 48-96 hours after online publication and is updated daily on week days.
Initial download of the metrics may take a while.