Fig. 10.
Download original image
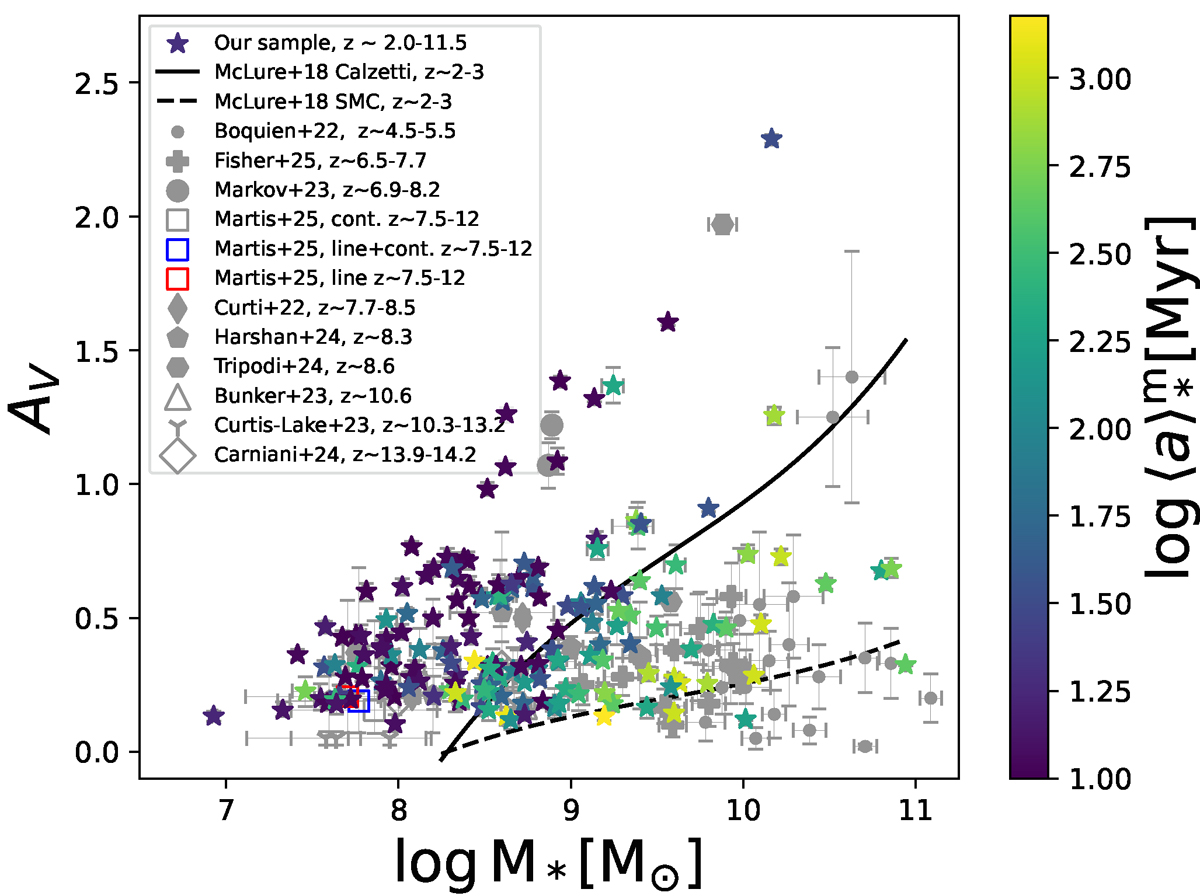
V-band attenuation (AV) vs. stellar mass (log M) color-coded by the mass-weighted stellar age (⟨a⟩*m). Our sources are represented as stars. The solid and dashed black lines indicate the predicted AV − log M relation by McLure et al. (2018), based on the assumption of Calzetti and SMC-like attenuation laws, respectively. We also include literature results for high-z sources (Boquien et al. 2022; Curtis-Lake et al. 2023; Curti et al. 2023; Bunker et al. 2023; Markov et al. 2023; Harshan et al. 2024; Carniani et al. 2024; Tripodi et al. 2024; Ormerod et al. 2025), shown as gray symbols. Median values for continuum, continuum+line, and line-only samples of z ∼ 7.5 − 12 galaxies from the JWST Technicolor (Program ID 3362) and CANUCS (Willott et al. 2022) surveys are indicated as empty gray, blue, and red squares, respectively (Martis et al. 2025). The 1σ uncertainties are indicated as error bars.
Current usage metrics show cumulative count of Article Views (full-text article views including HTML views, PDF and ePub downloads, according to the available data) and Abstracts Views on Vision4Press platform.
Data correspond to usage on the plateform after 2015. The current usage metrics is available 48-96 hours after online publication and is updated daily on week days.
Initial download of the metrics may take a while.