Fig. B.1.
Download original image
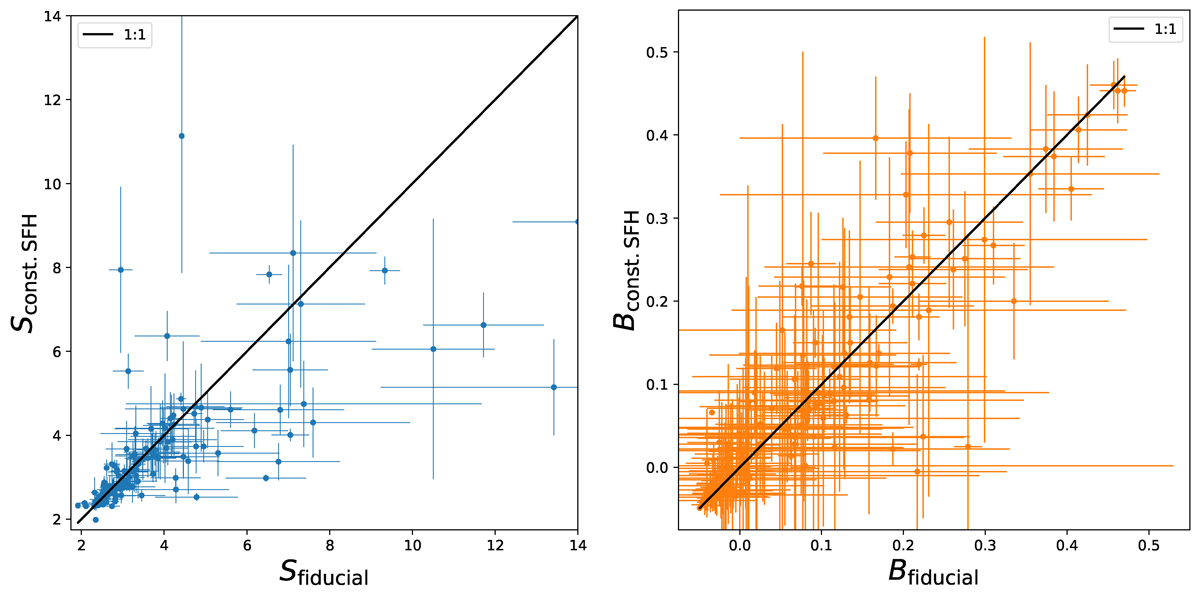
Dust attenuation curve parameters S and B derived from SED fitting using two different star formation histories: a constant SFH and the fiducial flexible (non-parametric) SFH model (Leja et al. 2019). The left panel shows the slope parameter S (blue), and the right panel shows the UV bump strength B (orange). The solid black line indicates the 1:1 relation.
Current usage metrics show cumulative count of Article Views (full-text article views including HTML views, PDF and ePub downloads, according to the available data) and Abstracts Views on Vision4Press platform.
Data correspond to usage on the plateform after 2015. The current usage metrics is available 48-96 hours after online publication and is updated daily on week days.
Initial download of the metrics may take a while.