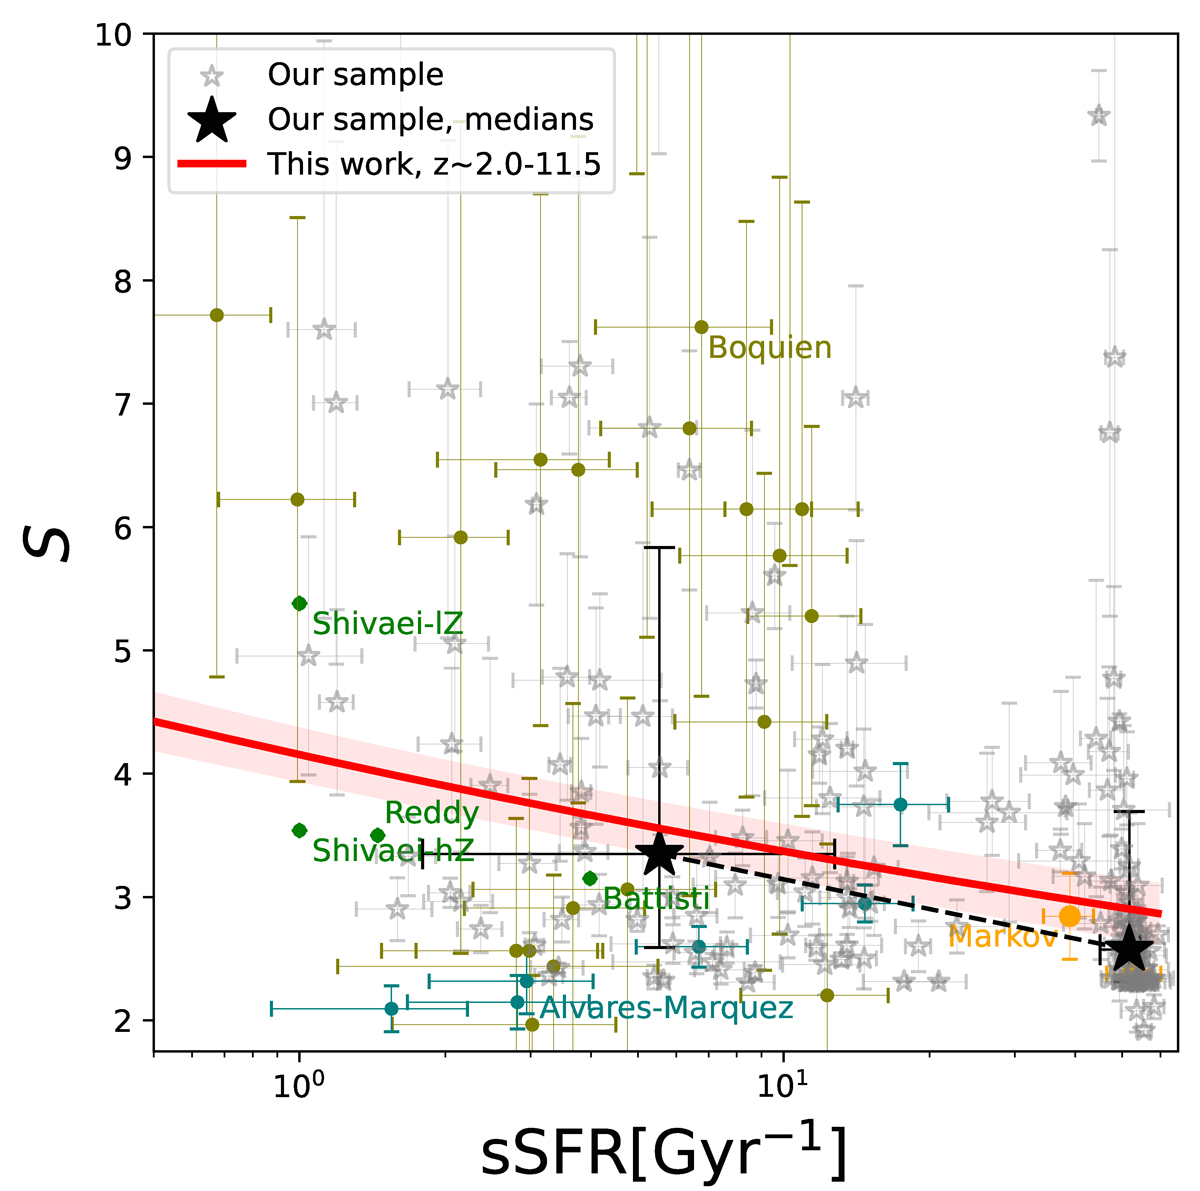
Fig. C.1.
Download original image
UV-optical slope (S) as a function of the sSFR. Gray stars represent individual S measurements from our sample, with 1σ uncertainties estimated via bootstrapping. Black stars show the median S values for galaxies grouped by sSFR, with error bars indicating the 1σ dispersion within each bin. The solid red line shows the best-fit relation for the full sample using a power-law model (Eq. 4), and the shaded region denotes the associated uncertainty. Literature results for intermediate-z sources or stacks are shown in green (Reddy et al. 2015; Shivaei et al. 2020a; Battisti et al. 2022) and teal (Álvarez-Márquez et al. 2019), while high-z objects (Boquien et al. 2022; Markov et al. 2023) are displayed as olive and orange symbols, respectively. Error bars represent their 1σ uncertainties.
Current usage metrics show cumulative count of Article Views (full-text article views including HTML views, PDF and ePub downloads, according to the available data) and Abstracts Views on Vision4Press platform.
Data correspond to usage on the plateform after 2015. The current usage metrics is available 48-96 hours after online publication and is updated daily on week days.
Initial download of the metrics may take a while.