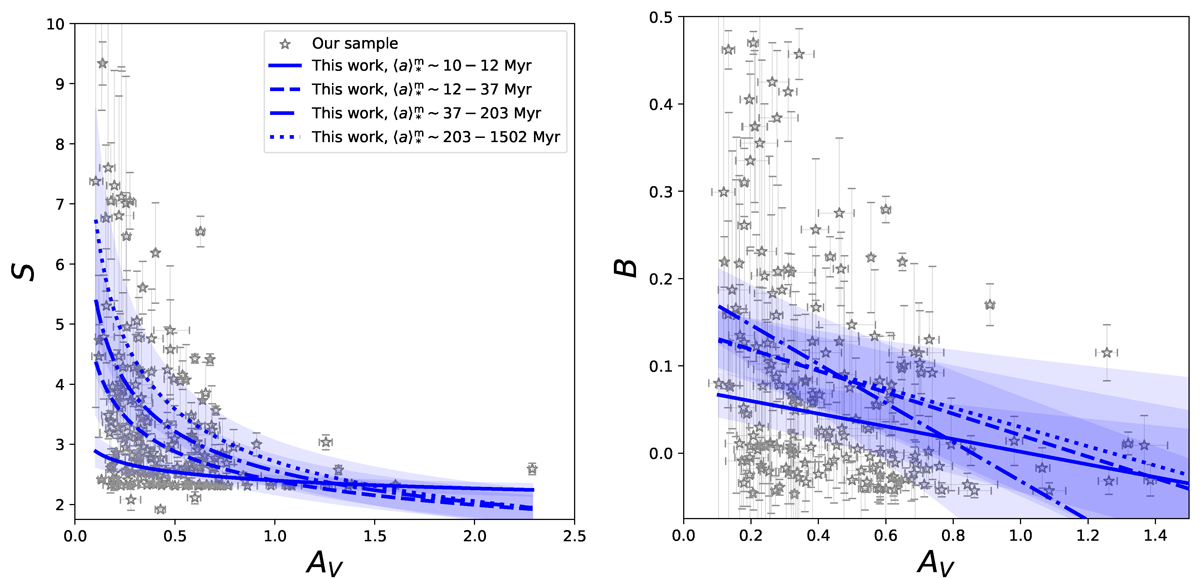
Fig. E.2.
Download original image
Dust attenuation parameters as a function of V-band attenuation, AV. Our sample is represented as gray stars. The left panel shows the UV-optical slope (S), while the right panel displays the UV bump strength (B) as a function of AV. Blue lines show the best-fit correlations and their 1sigma uncertainties for the subsets grouped by stellar ages, with shaded regions indicating the uncertainty ranges.
Current usage metrics show cumulative count of Article Views (full-text article views including HTML views, PDF and ePub downloads, according to the available data) and Abstracts Views on Vision4Press platform.
Data correspond to usage on the plateform after 2015. The current usage metrics is available 48-96 hours after online publication and is updated daily on week days.
Initial download of the metrics may take a while.