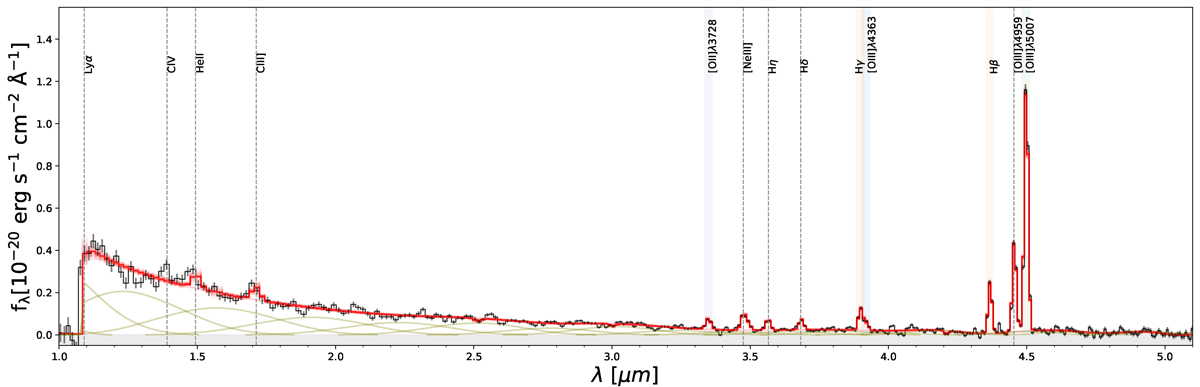
Fig. 2.
Download original image
Example of SED fitting results for a galaxy with oxygen abundance measurements (1210_5173 at z ≈ 7.99). The NIRSpec prism spectrum (black) and the best-fit model (red) are depicted with their respective 1σ uncertainties. The vertical lines indicate the positions of key optical emission lines we used to estimate the oxygen abundance: Hγ and Hβ (orange), [O II}] λ3728 (purple), [O III] λ4363 (blue), and [O III] λ5007 (green). The vertical dashed gray lines indicate the positions of the remaining emission lines. The olive lines indicate the continuum emission levels.
Current usage metrics show cumulative count of Article Views (full-text article views including HTML views, PDF and ePub downloads, according to the available data) and Abstracts Views on Vision4Press platform.
Data correspond to usage on the plateform after 2015. The current usage metrics is available 48-96 hours after online publication and is updated daily on week days.
Initial download of the metrics may take a while.