Fig. 3.
Download original image
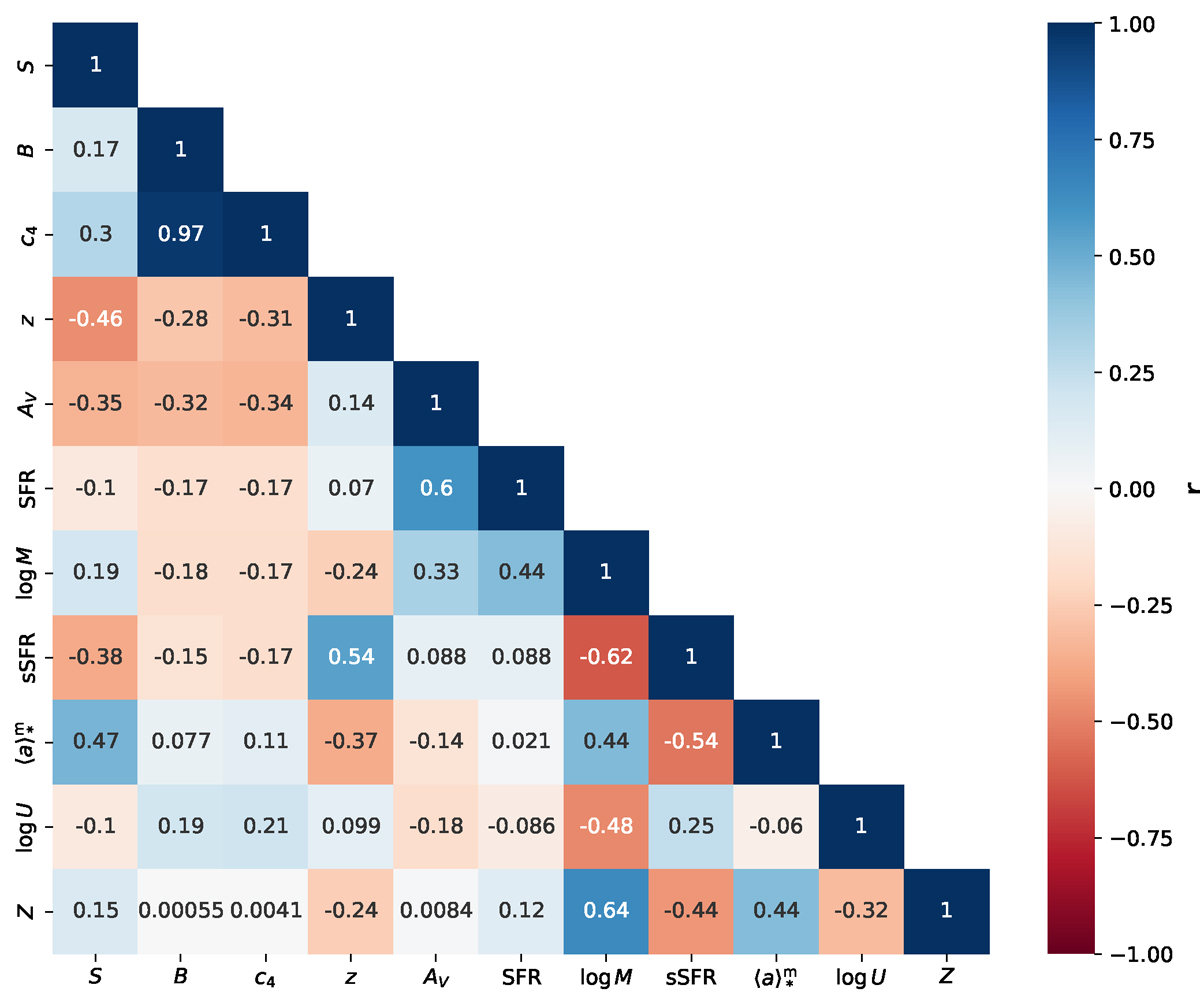
Correlation matrix heatmap for the dust attenuation curve properties (the UV-optical slope S and the UV bump amplitude, i.e., B and c4) and fundamental galaxy parameters as inferred from the SED fitting: Redshift (z), V-band attenuation (AV), SFR, stellar mass (log M), sSFR, stellar age (⟨a⟩*m), ionization parameter (log U), and metallicity (Z). The color-code represents Pearson correlation coefficient (r) values, which quantify the strength and the sign of the correlation. Typically, |r| = 1 signifies a perfect correlation, |r| = 0.7 − 1 a very strong correlation, |r| = 0.5 − 0.7 a strong correlation, and |r|∼0.3 − 0.5 a moderate correlation (Benesty et al. 2009).
Current usage metrics show cumulative count of Article Views (full-text article views including HTML views, PDF and ePub downloads, according to the available data) and Abstracts Views on Vision4Press platform.
Data correspond to usage on the plateform after 2015. The current usage metrics is available 48-96 hours after online publication and is updated daily on week days.
Initial download of the metrics may take a while.