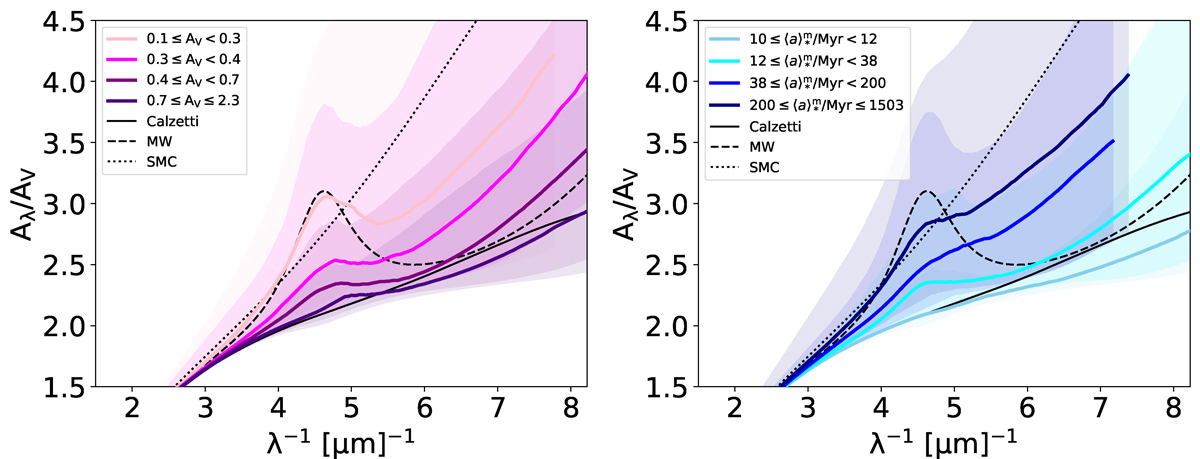
Fig. 5.
Download original image
Median dust attenuation curves for our full galaxy sample binned in terms of key parameters: (left panel) V-band attenuation (AV), and (right panel) mass-weighted stellar age (⟨a⟩*m). The median attenuation curves are plotted as solid lines, and the shaded regions indicate their 1σ dispersion. These curves and uncertainties were estimated using a bootstrapping approach, where 5000 synthetic curves were generated and the 16th, 50th, and 84th percentiles were taken from the resulting distribution. For comparison, the Calzetti, MW, and SMC empirical curves are displayed as solid, dashed, and dotted black lines, respectively. The bin limits were chosen to maintain a roughly equal number of sources per bin (∼40 − 50 sources in four bins).
Current usage metrics show cumulative count of Article Views (full-text article views including HTML views, PDF and ePub downloads, according to the available data) and Abstracts Views on Vision4Press platform.
Data correspond to usage on the plateform after 2015. The current usage metrics is available 48-96 hours after online publication and is updated daily on week days.
Initial download of the metrics may take a while.